
In this 5th article on our Intro to Incident Response series, we dive into investigating user activity. It’s the last that focuses on users, helping investigators understand if an account is in fact compromised and what was accessed during the attack.
We’ll start with a refresher on the series, dive into the topic of user activity, and then show some examples using Cyber Triage.
30-Second Refresher
As presented in more detail earlier, this series is all about breaking big intrusion investigation questions into smaller questions that can be answered. There are three general categories:
- Is there suspicious user activity (such as sensitive files being accessed)?
- Are there malicious programs (such as malware)?
- Are there malicious system changes (such as relaxed security settings)?
At this point in our series, we’re still on the first bullet about users. That topic is broken into three medium-sized questions:
- Who: Which users were active on this system?
- When/Where: Are there suspicious logins to the system? If so, from where and when did they occur?
- What: Did the users do anything suspicious when they were logged in?
We already talked about enumerating users and looking at logins. Now, we are going to look at what the users did.
Why We Investigate User Activity in Incident Response
We’ve already outlined in the past posts that we need to investigate users because they could be inside threats, or their accounts may have been compromised. When an account is compromised, no malware is needed. The attacker can simply login as that user and steal data (or whatever they want).
We talked before about looking for anomalous login activity: perhaps at strange hours, from an unexpected location, or an unexpected login. But, maybe the attacker makes sure that none of that is out of the ordinary. They use the same times, accounts, and similar login behavior.
That’s why we look to see what happened when the user was logged in. Maybe we can find evidence of malicious activity.
What Suspicious User Activity Should Incident Responders Look For?
The theme of this series is breaking questions down.
So, let’s break the question of “Did the users do anything suspicious when they were logged in?” into smaller questions:
- Did the users launch any suspicious programs?
- Did the users access anything suspicious with expected programs?
After all, the only thing users can really do is cause programs to be executed by the OS and interact with the OS and programs.
Where Do We Find the Data?
There are new artifacts of user activity being found all the time by incident responders. Below are lists of commonly used artifacts that have been discovered over time. Some have been around for many versions of Windows and others are brand new to Windows 10.
There are many sites with lists of such artifacts (such as this one) and tools that parse many of these (such as RegRipper, Eric Zimmerman, Cyber Triage, and more).
Evidence of Program-Launching Activity to Look for in an Incident Response Investigation
While not on by default, Windows computers can be configured to log each time a process is started. If that was enabled, look for event types 4688 or 592 in the Security event logs.
Otherwise, you’re left looking for artifacts of the program launching. These artifacts are not created for audit or investigation purposes, but they can be useful nonetheless. You will often see the same program is referenced in multiple places.
Examples include:
- RunMRU: Windows saves the “most recently used” (MRU) values typed into the “Run” dialog
- MUICache: Windows saves the name of launched programs in the registry. More details can be found here
- UserAssist: Another place that Windows stores information about programs that were launched and this one also includes the number of times it was run and the date of the most recent run
- AppCompatCache/ShimCache: Windows can change the execution environment for applications to ensure it is compatible with older applications. When a program is executed, it stores this compatibility information in the AppCompatCache (also referred to as ShimCache). More details can be found here
- Background Activity Monitor (BAM): Starting in Windows 10, this records information about programs that were running in the background
- Prefetch: Windows stores information about previously launched programs so that it can preload them before they are launched again. More details can be found here
- RecentApps: Contains a list of recently used apps that the user launched. More details can be found here
- RecentFileCache/AmCache: Yet another place that Windows stores information about previously run programs. It has different names and formats in different versions of Windows. More details can be found here
- JumpLists: Records recently accessed files and programs. More details can be found here
- System Resource Usage Monitor (SRUM): Maintains information about what apps were running, energy used, etc. More details can be found here
- Windows Timeline: Windows 10 introduced a feature to show a timeline of recent activity. It stores program execution dates. More details can be found here.
Evidence of User Access Activity to Look for in an Incident Response Investigation
Some programs can be used for good and bad, so we need to know more than only that it was launched. For example, web browsers can be used to visit benign sites or to download malicious programs. Or, Windows File Explorer can be used to access normal files that an employee needs to do their job, or it can be used by an attacker to access sensitives files on a network share.
So, we also want to look at what resources were accessed when the program was launched. Not all programs will provide this level of visibility into what they do. But, we can try to take advantage of those that do.
- File Explorer:
- ShellBags: Windows keeps track of what folders were opened and stores them with metadata. More details can be found here
- RunMRU: Users can also type in file and folder names into the Windows “Run” box, so in addition to showing you what programs were run, it can also show you what files were accessed
- Web Activity: All of the various browsers store browsing history, downloads, cookies, etc. in databases or files
- Application Most Recently Used (MRU) Lists: Many applications store a list of recently opened files to make it easier for the user to open them again. These can all be parsed to learn what files were opened. Each application stores the information in a different place and in different formats. As a quick reference, an outdated list of application MRUs can be found here.
How to Analyze User Activity in Incident Response
Once you have data from all of the above locations, you need to analyze it to look for suspicious behaviors. It’s much easier to use this data to answer a more directed question, such as “was program [X] executed?”
Here is the approach that I typically use for detecting suspicious programs launches:
- De-dupe: You’ll see the same program mentioned in many of the above places. De-dupe to get the minimal set
- Malware: Analyze the programs for malware using many engines, such as Reversing Labs, Virus Total, OPSWAT, or PolySwarm
- Signature: Check if the executable is signed. Malicious programs can certainly be signed by legitimate certificates, but it’s always good to get a first pass to see which ones aren’t even signed
- Path: Check if the program is in a typical place (such as C:Windows or C:Program Files) or a folder such as “Temp,” “AppData,” etc. Note that many legitimate programs will run out of AppData, such as auto-update programs
- Dates: Compare the dates on the program launch and the program itself with other dates associated with the incident.
To detect suspicious web activity, you should use a process such as:
- Strip the URLs down to domains
- De-dupe them to unique domains
- Look them up in reputation/threat intelligence databases.
To detect suspicious file accesses, you’ll need to:
- Understand the normal role of the user and what kinds of data they should be accessing
- Know what is in various file share locations (such as where engineering versus finance data is stored)
- Know what are in the various files accessed.
As has become a common theme in this series, a big challenge for the responder is knowing what is normal for the computer and user in question.
Analyzing User Activity Using Incident Response Software Cyber Triage
If you are using Cyber Triage, then you can answer these user activity questions using three parts of the UI. We’ll assume you’ve already collected data from the suspected system using one of our agentless collection methods.
If you’d like to follow along using Cyber Triage to answer questions about users or malware, download a free evaluation copy here.
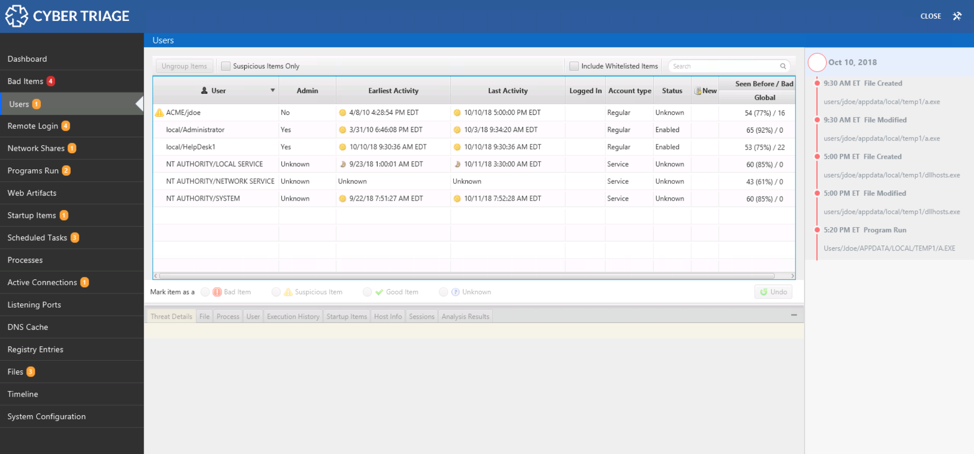
The navigation menus on the left-hand side of Cyber Triage are organized based on the same ideas that this blog series uses. The first items are all about users. The next set is about malware. The last is about system configuration.
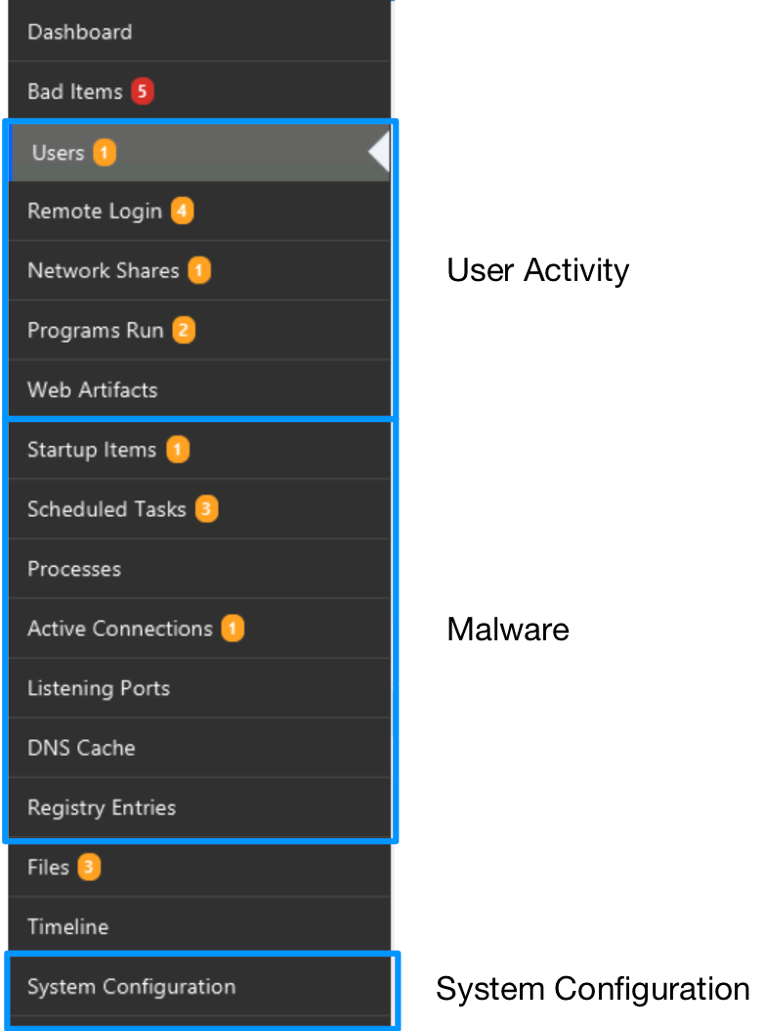
For the questions outlined above, we’re going to focus on the bottom three items for “Users,” which are “Network Shares,” “Programs Run,” and “Web Artifacts.”
Program Run Section
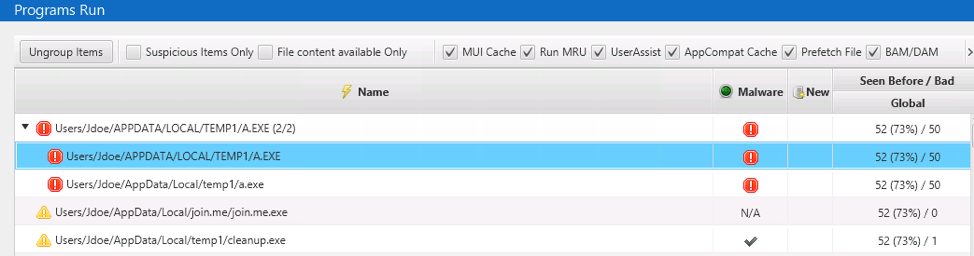
The Cyber Triage collection tool parses the various registry keys and files mentioned above that store information about where you can find evidence of program execution (Prefetch, MUICache, etc.). The wildly different formats get normalized to a standard set of data and displayed in the “Program Run” area:
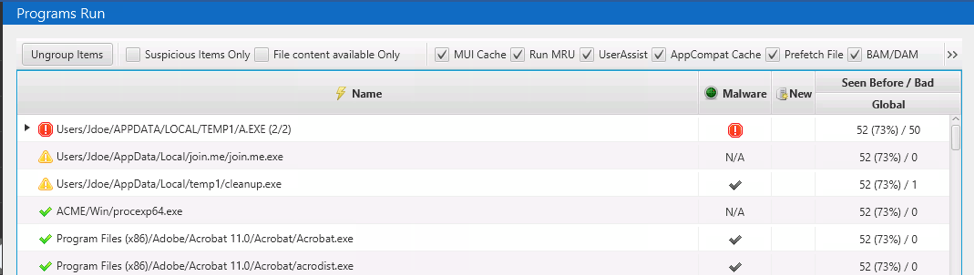
Cyber Triage groups them based on their parent folder. This helps in two ways:
- It helps to de-dupe when you see the same file from various artifacts
- It helps reduce the noise when you see multiple programs running out of the same folder.
With this data, you can look for suspicious program executions. Cyber Triage will analyze the items and assign scores based on:
- The path of the executable
- If the executable is signed
- The Reversing Labs malware analysis results from the executable
- Yara rules
- denylists and allowlists from past sessions.
Based on this analysis, the programs will be scored as:
- Bad if there was known malware or if a Yara or denylist rule matched
- Suspicious if the path was suspicious, not signed, or Reversing Labs came back with a low number of engines that flagged it
- Good if the file matched a past allowlist entry or a reliable and clean Reversing Lab result
- Unknown if none of the above apply.
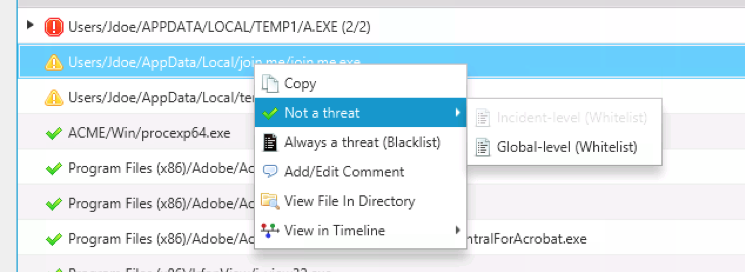
When looking at the programs that were run, you will likely get false positives from programs that execute out of an AppData folder, such as many video conferencing applications.
If the program has been in the wild long enough, then a clean Reversing Lab results will overrule the score associated with the suspicious path. But, if the program is relatively new, then it will still get marked as suspicious.
To deal with this, you should add the program to your allowlist:
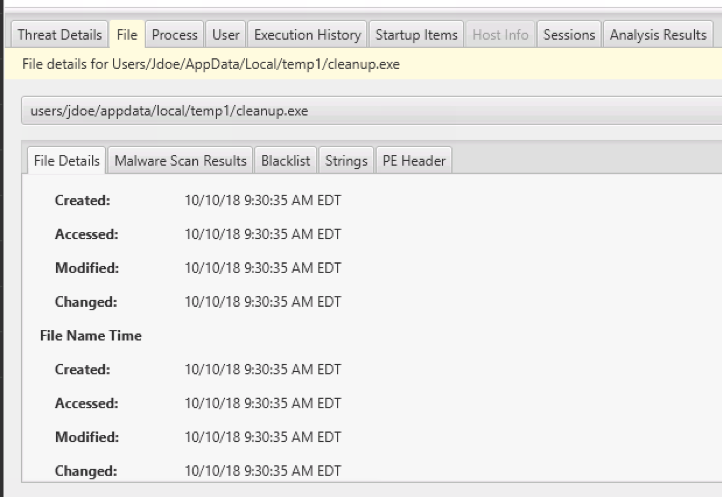
As you are reviewing the programs that were executed, you can use the bottom area (“Related Info” as we call it) to get additional information, such as:
- All 8 NTFS timestamps for the programs
- Process and network information if the program is currently running
- The user associated with running the program and their login behaviors
- Other systems that the program can be found on.
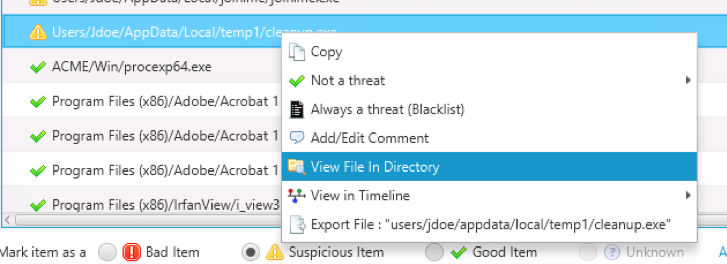
You can also right-click on the item to see what else is in the same folder as the program:
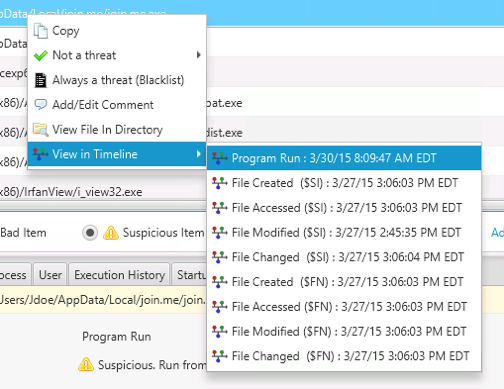
Or, you can jump to the timeline to see what happened before and after the program was run or when the executable file was created:
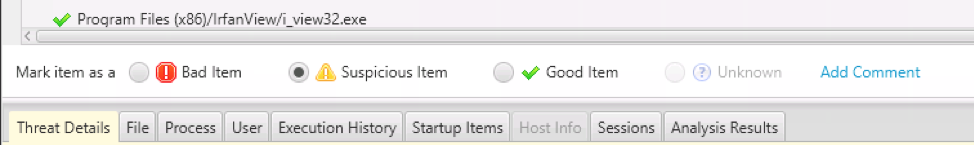
As with all data types in Cyber Triage, when you want to mark an item as “Bad” or “Suspicious” (so that you can follow up on it), you can use the bar under the table:
NOTE: This section also contains information about what files were accessed (such as from RunMRU) and folders (such as from ShimCache). A near-term release will move those items out of this area.
Network Shares Section
The second relevant section in Cyber Triage is the “Network Shares” section, which shows you a list of the UNC network paths that were accessed from the computer. This comes from a combination of:
- Drive mappings that assign a drive letter to a UNC path
- Entries from RunMRU, ShimCache, and other places that had a UNC path for the file or folder accessed.
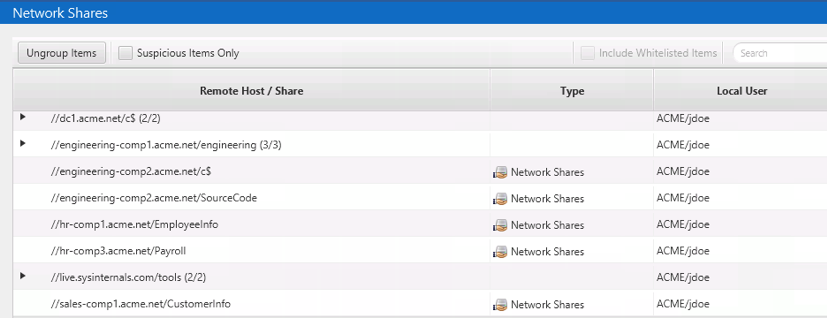
You can use this section to review what file shares were accessed and determine if any are suspicious based on the role of the user.
Web Artifacts Section
Lastly, the “Web Artifacts” section contains entries for web downloads, cookies, and history. It groups the items by domain so that very popular sites, such as “google.com”, do not overwhelm the UI:
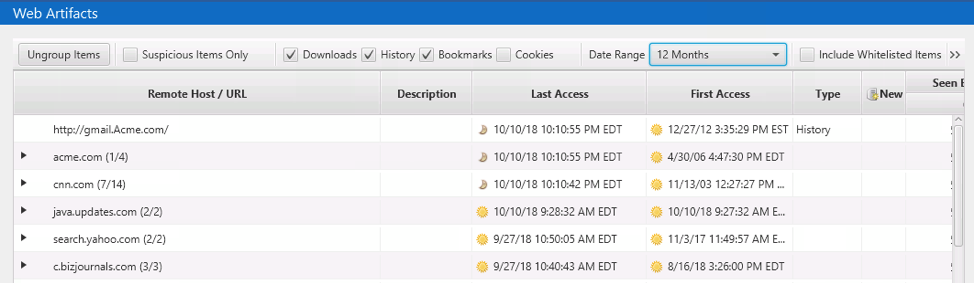
The table also provides date ranges for the earliest and most recent activity for that domain, which helps to isolate the domains that have not been accessed for a long time or that have been in use for a long term.
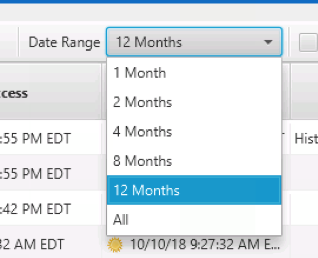
By default, there is a filter applied for the date range to show only the past 2 months of activity. But, you can change that:
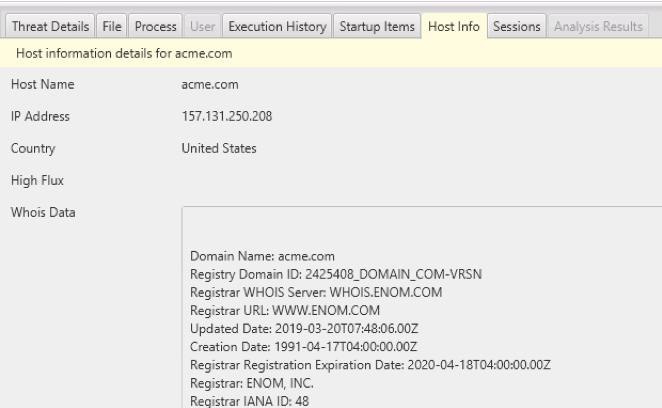
The bottom area will show you information such as the “WHOIS” information for a given domain:
It can be hard to determine which sites may have provided malware to the user. Some techniques that you can use include:
- Filter the items to show only downloads. That should decrease the number of entries dramatically
- Import data from OpenPhish as denylist information. References to domains mentioned in OpenPhish data will be marked as “Bad.”
Example Incident Response Investigation of User Activity
In our data set, we have a file that was flagged by Reversing Labs as being malware, and it was therefore marked as “Bad.” There were Prefetch and UserAssist entries for it:
If we right-click on the file and jump to the timeline, we’ll see that after this program was launched, some encrypted ZIP files were created.
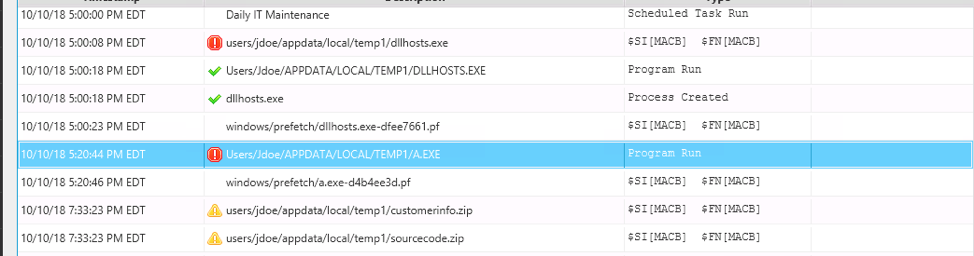
After looking at the timeline around the time this program was run, we can return back to review the other suspicious “Program Run” entries.
Conclusion
Analyzing user activity is critical to understanding if an account was compromised and what they got access to. This is important when the attacker has been successful at blending in in all other ways.
In this post, we broke the question of “is there suspicious user activity” into two smaller questions that we can find data to answer. We also showed how you can use Cyber Triage to find these answers.
If you’d like to try Cyber Triage to answer questions about users or malware, download a free evaluation copy here.


