Automated endpoint triage sounds great in theory. But what does it actually look like in practice?
Here’s a walkthrough of how SOC analysts use Cyber Triage after an EDR alert fires.
The scenario: The EDR detected activity with potential credential access. The analyst reviewed the EDR alert and confirmed it’s not a false positive. Now they need to determine: Is this an isolated incident or part of a larger compromise?
The 6 steps:
- Import EDR telemetry for automated scoring
- Collect additional forensic data from the endpoint
- Review system overview and flagged items
- Investigate bad and suspicious artifacts
- Follow recommended correlations
- Make a decision based on findings
Total analyst time: 20 minutes
Step 1: Import EDR Telemetry
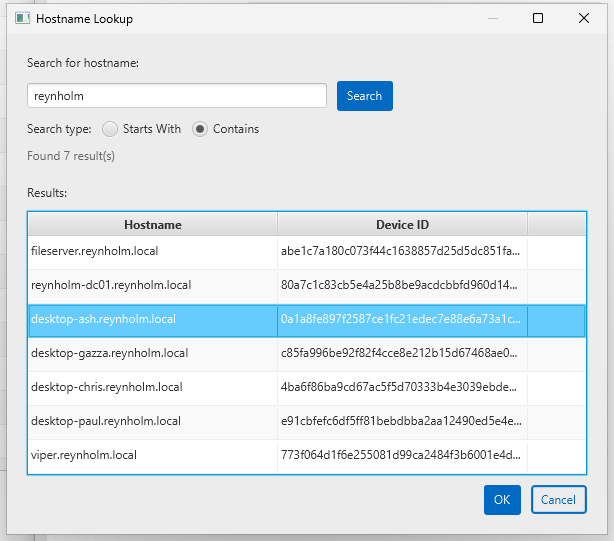
The analyst opens Cyber Triage, creates a new incident, and selects the host:
Cyber Triage imports the past 30 days of EDR telemetry (typically 300,000+ events) and begins scoring each artifact as bad, suspicious, or benign.
This happens automatically in the background while the analyst moves to step 2.
Step 2: Collect Additional Forensic Data
EDRs have excellent telemetry, but gaps exist:
- If EDR evasion was used, telemetry may not be recorded
- Browser URLs (EDRs typically only capture encrypted connection IPs)
- Files and registry keys the EDR doesn’t monitor
The analyst triggers the Cyber Triage Collector deployment via the EDR (or SOAR):
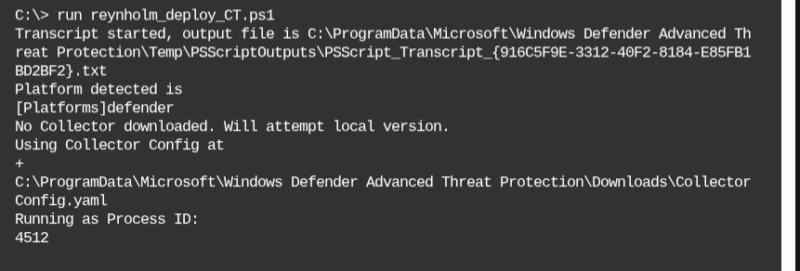
The collector gathers forensic data from the endpoint and sends it to Cyber Triage (or cloud storage like Azure/S3) for analysis.
Step 3: Review System Overview
The analyst starts with the high level overview to understand:
- What bad and suspicious items were found
- Who logs into this system
- What processes recently started running
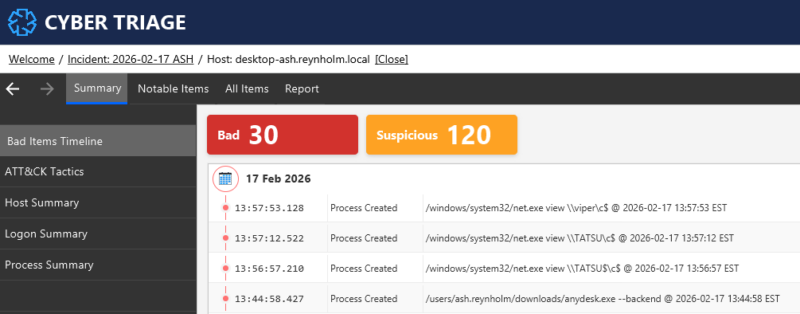
We can see here that 30 bad and 120 suspicious items were found from the 300k+ items.
We can use the MITRE ATTT&CK View to group items by persistence, data exfiltration, etc.
From the overview, we learned that:
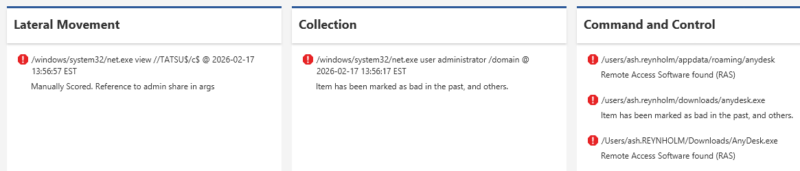
- Remote access software (AnyDesk) was installed for persistence
- Reconnaissance techniques were used to see what data was on other systems.
Step 4: Investigate Bad and Suspicious Items
The analyst reviews each flagged item. Some suspicious items will turn out to be normal business activity. Others will be malicious.
For each item, Cyber Triage shows:
- Why it’s flagged (malware match, behavioral anomaly, threat intel hit)
- Historical context (if it was seen before, other hosts with it)
- Correlations (related processes, files, network connections)
For example, some of the suspicious activity was new web traffic to Dropbox, which can be used for data exfiltration.
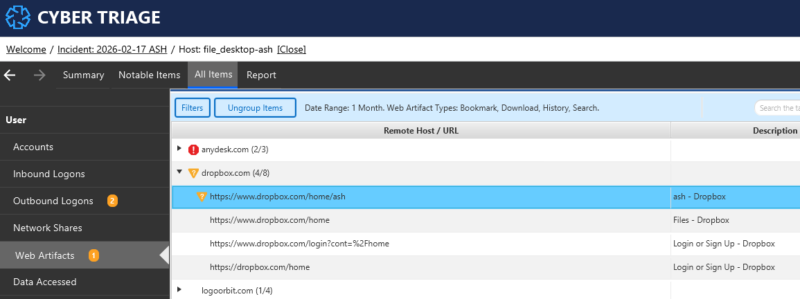
That activity could be viewed in the timeline to identify which files were uploaded.
Step 5: Follow Recommended Artifacts
As the analyst marks items as bad, Cyber Triage recommends related artifacts to investigate.
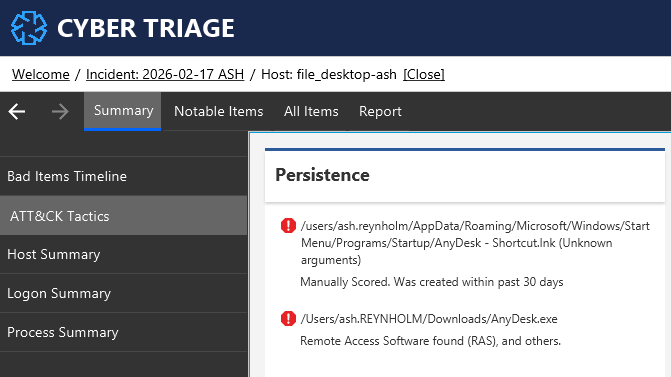
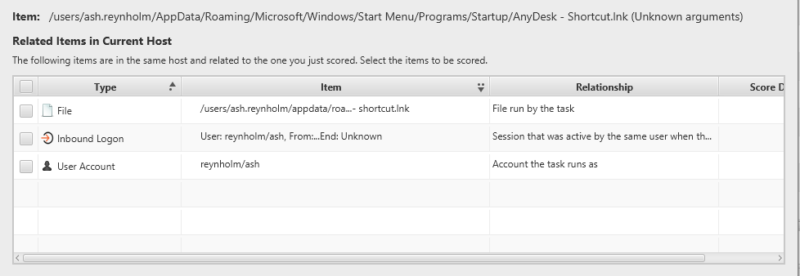
As an example, one of the suspicious items was a triggered task that provided persistence for the remote access software. When the analyst marks that as “bad”, then Cyber Triage will also recommend:
- The user account that created the task
- The login session that was used to create the task (which can tell you where they came from)
- Underlying files of the task (in this case an LNK file)
Step 6: Assess the Compromise
After reviewing all bad and suspicious items, the analyst evaluates:
- Lateral movement: Evidence of access to other systems?
- Partial: Evidence was found of copying data from other systems, but not logging into them.
- Data exfiltration: Evidence of data leaving the network?
- Yes: A TAR file was uploaded to DropBox
- Persistence: Can the attacker return?
- Yes: Anydesk was installed on the system to allow for remote access
Decision: Escalate immediately. This is an active breach requiring incident response.
The Result
Total time: 20 minutes from EDR alert to escalation decision
Without endpoint triage, this would have been closed as “potential credential access, ticket closed.” The persistent threat would have remained.
Try Cyber Triage in Your Environment
See how Cyber Triage works with your EDR and alerts.