EDR telemetry is one of the fastest and most complete sources of evidence for intrusion investigations.
But what’s the best way to investigate with it?
This post covers the 3 most common ways SOC analysts and DFIR teams investigate using EDR data, breaks down the pros and cons, and provides quick, step-by-step how-tos for each method.
Let’s get to it…
Jump to a section
Top 3 Ways to Investigate Telemetry
Method 1: Use the EDR Console
Method 2: Import into Excel
Method 3: Import into Investigation Platform
How to Investigate EDR Telemetry with Cyber Triage
Top 3 Ways to Investigate Telemetry
The 3 most common methods for investigating EDR telemetry are:
- EDR console
- Excel export
- Investigation platform
We dive into each of these methods below, but this table is a summary of how they compare across 10 features:
| Feature | EDR Console | Excel export | Investigation platform |
|---|---|---|---|
| Data access speed | Fastest – Real-time | Slow – Manual export/import | Fast – Direct ingest via API |
| Multi-source evidence | No – Limited to EDR data | No – Only what’s exported | Yes – SIEMs, other sources |
| DFIR-grade collection | No – Limited to telemetry | No – Only what’s exported | Yes – Native DFIR collector |
| Data retention | Limited – Rolls over | Yes – Long-term retention | Yes – Long-term retention |
| DFIR-grade UI | Moderate – Detection focus | No – General purpose | Yes – Investigation focus |
| DFIR-grade scoring | No – Alert-level analysis | No – All manual analysis | Yes – Investigation-level analysis |
| Clue detection | No – Bad item focus | No – All manual analysis | Yes – Bad and suspicious focus |
| Case management | No | No | Yes – Labeling, collaboration, etc. |
| Learning curve | Moderate – Query language | Low – Familiar tool | Moderate – New tool |
| Best for | Alert triage | Not recommended | Endpoint triage, full investigations |
Now, let’s take a look at each method in more detail.
NOTE
Cyber Triage is an investigation platform that supports all these features and many more. Want to see if it could improve your investigations?
Contact us and ask for a demo of the Enterprise tier of Cyber Triage.
Method 1: Use the EDR Console
Description: Use the EDR or XDR web-based console to review activity.
Recommended for: Tier 1 investigations like validating alerts (AKA alert triage).
How:
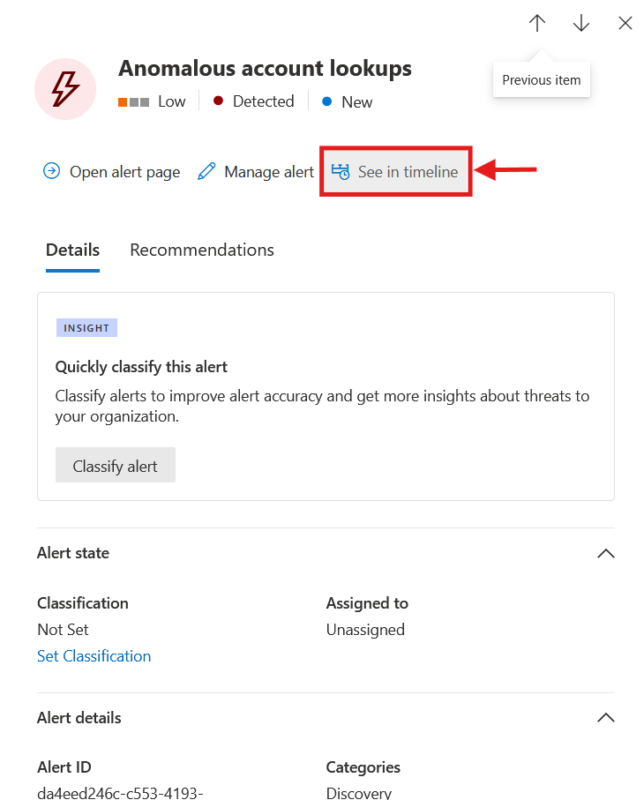
Step 1: Login: The same place you see alerts.
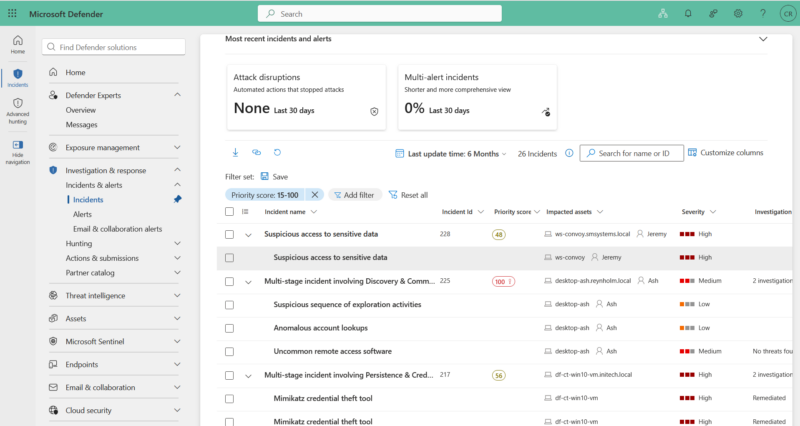
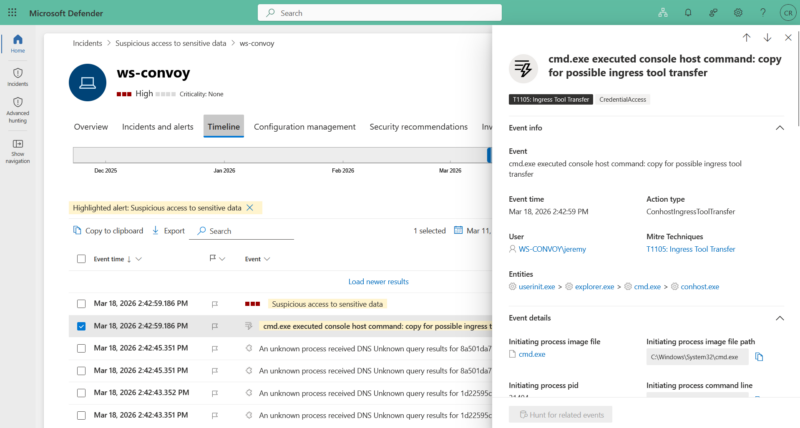
Step 2: Jump to the timeline.
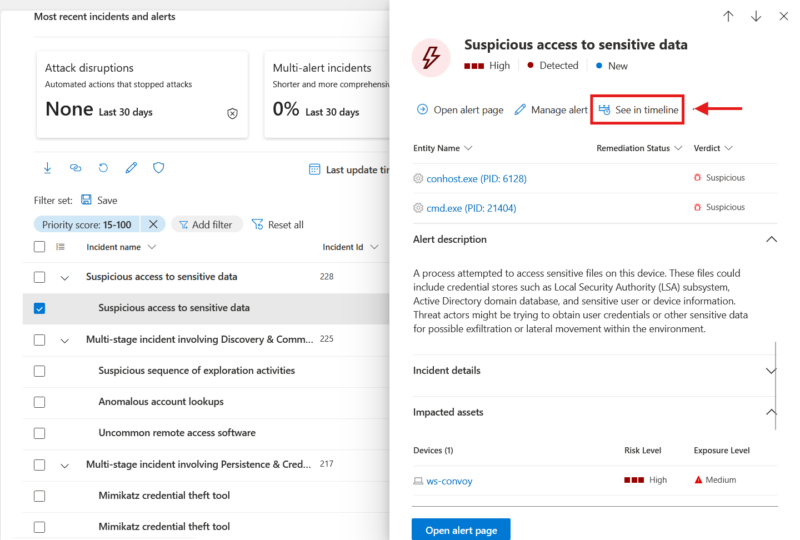
Step 3: Review the data available.
NOTE
Most often have their own query language. Ex: Defender uses Kusto Query Language (KQL)
| Pros | Cons |
|---|---|
| Fastest access: Just log in. | Lots of data to look at. Potentially overwhelming so easier to miss important items and evidence. |
| No additional software required. | Doesn’t show you suspicious data (AKA clues). |
| Boosts the ROI of EDR spend. | Doesn’t offer labeling and other case management features. |
| Is the preferred method for relatively straightforward investigations like validating an alert (alert triage). | Doesn’t offer easy collaboration to have someone review specific data. |
| Investigation is not an EDR’s primary function: Built for detection first, not DFIR-grade analysis. | |
| Requires knowledge of the EDRs query language when the investigator wants to pivot. | |
| Only shows XDR or EDR data. Other data may be in a separate location and could require manual importing and correlation. This is also particularly important in cases where EDR evasion may have been used, where using other sources is critical to the investigation. | |
| Data rolls over and is lost for future audits. |
Method 2: Import into Excel
Description: Export data from the EDR console and import into Excel (or similar).
Recommended for: Not our first recommendation for any type of investigation, but some practitioners prefer it.
How:
Step 1: Login: The same place you see alerts.
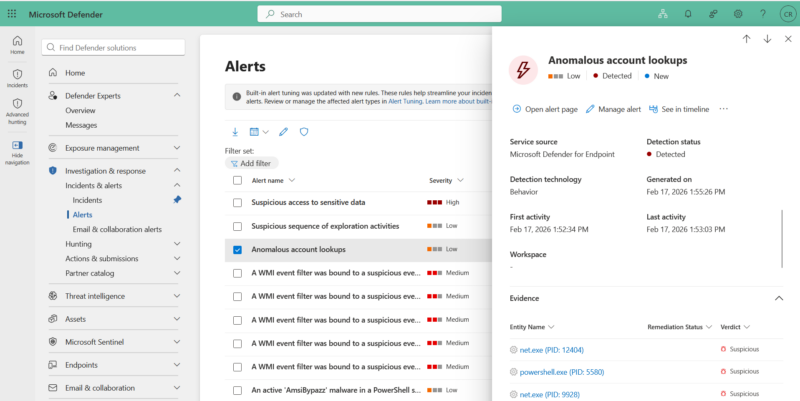
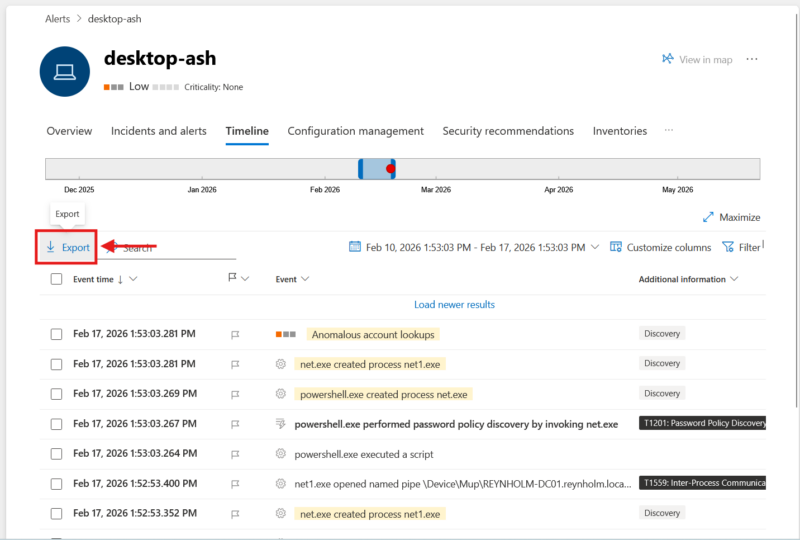
Step 2: Navigate to the host’s device timeline.
Step 3: Export data.
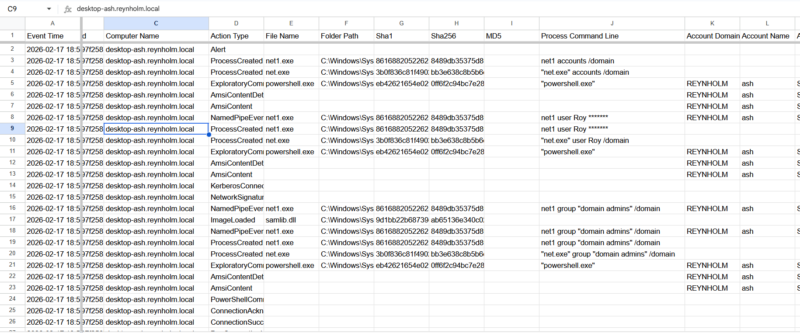
Step 4: Import into Excel.
NOTES
While Defender has a timeline view you can export as we covered above, sometimes, you’ll need to navigate to different data types (processes vs network connections) and export each one. Then import into Excel and filter. Using scripts initially can be a solution.
Defender timeline can only export 7 days of data per export.
| Pros | Cons |
|---|---|
| No additional software required. | Lots of data to look at. Potentially overwhelming, so it’s easier to miss important items or evidence. |
| Excel filtering can be easier than KQL (and other EDR query languages) for simple queries. | Doesn’t show you suspicious data (AKA clues). |
| Can be the preferred method for some experienced practitioners. | Maybe too much for Excel without further reductions from the export or a script. |
| Excel skills are transferable (unlike EDR query languages). | Doesn’t offer labeling and other case management features. |
| Sometimes the only option for consultants that don’t get access to a customer’s EDR (they are just sent data). | Doesn’t offer easy collaboration to have someone review specific data. |
| It’s easy to do. For example, exporting data from tables is much easier than exporting via API or knowing the right queries to get the data. | Investigation is not Excel’s primary function: Built for general-purpose data analysis. |
| Only shows exported data in a single table. | |
| Other data may be in a separate location and could require manual importing and correlation. This is particularly important in cases where EDR evasion may have been used, where using other sources is critical to the investigation. |
Method 3: Import into Investigation Platform
Description: Export data from the EDR and import into an investigation platform.
Recommended for: Most investigations, but particularly complex investigations like validating an incident (AKA endpoint triage) or investigating an incident (AKA full investigation).
How:
- Either export data via CSV (similar to above) or connect the platform directly to the EDR API.
- The platform imports data and then normalizes and scores to highlight what to focus on.
For a full walkthrough of how to do this with our investigation platform (Cyber Triage), see the step-by-step guide below.
| Pros | Cons |
|---|---|
| Automatically highlights suspicious items and clues so important items are prioritized (and less likely to be missed). | Additional software to purchase. |
| Offers case management with labeling and collaboration. | Investigators have to learn to use an additional tool. |
| Retains data after the investigation is completed for future analysis, re-examination, etc. | This requires integration, so there is some setup involved. |
| Investigation is the platform’s primary function (as opposed to EDRs or Excel, where investigation is at best a secondary function). | May introduce a delay vs just opening the EDR console. |
| Can import data from other sources (SIEMS, etc.) for more comprehensive evidence and analysis. | |
| Is the preferred method for most investigations, but particularly complex investigations like validating an incident (endpoint triage) or investigating an incident (full investigation). | |
| Can execute collection of DFIR-grade evidence. This almost always good practice, but it’s critical in cases where EDR evasion may have been used. |
Walkthrough: How to Investigate EDR Telemetry with Cyber Triage
Here’s how to import and analyze Defender telemetry in our investigation platform, Cyber Triage, using the API import option we mentioned above.
How to Ingest EDR Data in Cyber Triage
The steps below are all you need to do after setting up the API. Here’s how to do that for Defender.
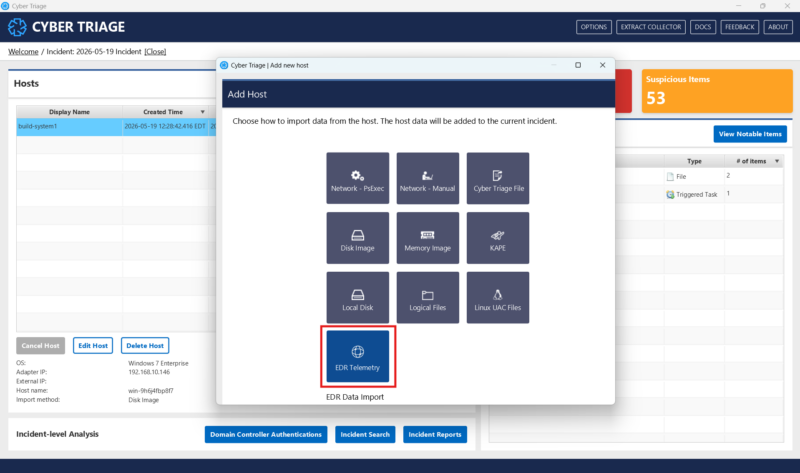
Step 1: Open up Add Host and select EDR telemetry.
Step 2: Find the hostname in Cyber Triage.
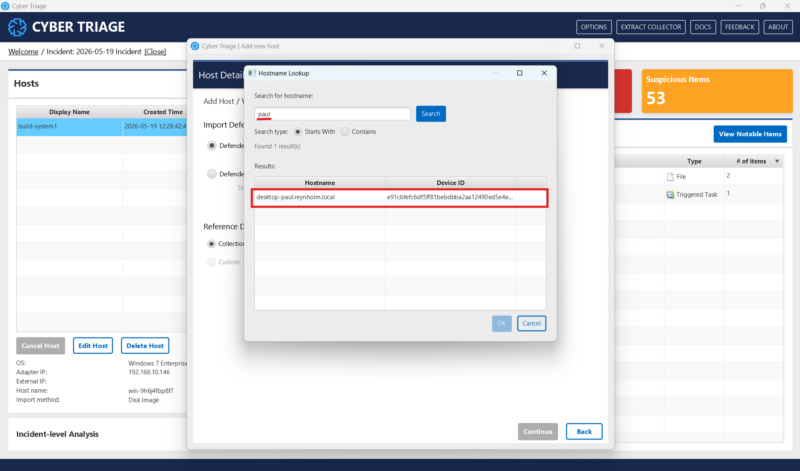
Choose the “Lookup” button and then search for and pick the hostname. (This list comes from Defender).
Doing this will pull 30 days of Defender telemetry into Cyber Triage.
NOTE
You can also import via a CSV file. Here’s how to do that:
How to Analyze EDR Data in Cyber Triage
Let’s use a scenario to explain the difference between analyzing EDR telemetry in the EDR console vs using an investigation platform like Cyber Triage.
NOTE
This scenario was run by our team on an endpoint monitored by Defender in November of 2005.
In our scenario, an attacker has spent 6 days in our environment: Nov 25 – Nov 30. They gained access through a fishing email on November 25 and installed AnyDesk. From Nov 26 – Nov 29, they scanned the local network, mapped network shares, saved browser creds, exfiled data, etc.
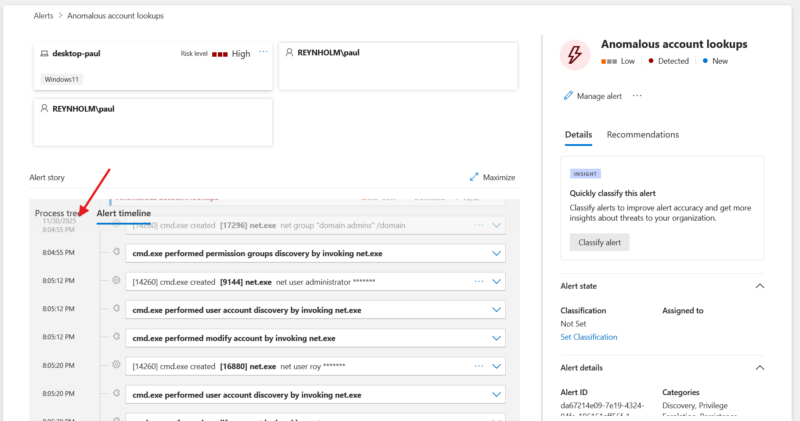
Finally, on Nov 30, Defender fires an alert.
In Defender, the first item flagged in the timeline relevant to this intrusion was on November 30. Nothing else is highlighted as notable or important:
But analyzing the same telemetry in Cyber Triage tells a different story:
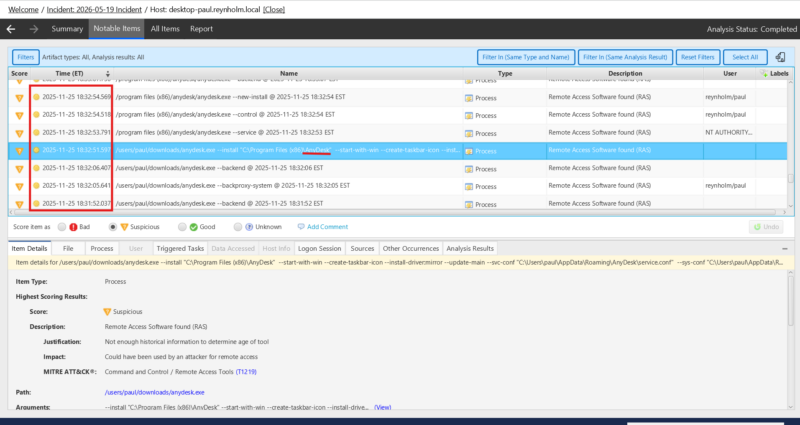
Numerous items from the first day of the intrusion (Nov 25) are flagged, including the installation of AnyDesk. And many more are scored “Bad” and “Suspicious” between that day and Nov 30 (the day the alert fired). None of this attacker activity is highlighted by Defender.
The reason is design:
- EDRs are designed to highlight the bad. This is ideal for the detections that drive alerts.
- Investigation platforms are designed to highlight the bad and the suspicious. This is ideal for the detections that drive investigations. ’
This is just 1 example of the value of investigation platforms for analyzing EDR telemetry during an intrusion, but there are many more.
If you’d like to see if this method has value for your team, contact us and ask for a demo of the Enterprise Tier of Cyber Triage.
This version of Cyber Triage is specifically built to combine automated DFIR analysis with data from EDRs and other important sources.
Give it a try, and tell us what you think!