Sometimes the only evidence on an intrusion is in memory and not on disk. In these cases, memory forensics provides crucial evidence to your investigation. Cyber Triage now integrates with Volatility to parse memory images and display the results in the standard Cyber Triage interface. If you are an incident responder who uses memory images, this means that you can now analyze them with the benefit of an easy-to-use UI to pivot around and automate your workflow. The Volatility integration is available in all versions of Cyber Triage, including the free Lite version.
What is Volatility?
Volatility is the most popular memory forensics platform. It allows you to extract evidence and intelligence from a memory image. It has an active user and developer community who build new modules to support new analysis techniques and data types.
Volatility is a command-line drive tool that is run by specifying what module you want to run (such as looking for running processes) and what OS the memory image is from. It then parses the memory image looking for the specific types of data and produces a text or JSON output file.
Volatility is a powerful tool that allows advanced users to find evidence that cannot be found with other tools. But, like many command line tools, it can be tedious to run Volatility with multiple arguments, and difficult to merge the various output reports together.
Volatility in Cyber Triage
We integrated Volatility into Cyber Triage so that you can harness the parsing power of Volatility along with the intuitive Cyber Triage automation and interface. If you are a responder who always does a memory capture as part of your workflow, you can now pull it into Cyber Triage and integrate into your triage process.
When you import a memory image, Cyber Triage uses Volatility’s ‘kdbgscan’ module to detect the profile (i.e. operating system) and run a series of modules. Cyber Triage parses the module output, merges them together, and adds them to the database. When the results are available, they will get further analysis from Cyber Triage, and be displayed in the UI.
The initial integration focuses on running the Volatility modules that will produce similar data as our collection tool. This allows us to populate as much of the existing UI as possible. Future releases will run additional modules.
Please note:
- This integration does not allow you to pick and choose which Volatility modules to run and see the module output. Our goal is not to be just a GUI frontend to Volatility. Our goal is to make it easy to run memory analysis for basic triage and allow the user to navigate the results (such as being able to jump from a process, to its user, to their login times, etc.).
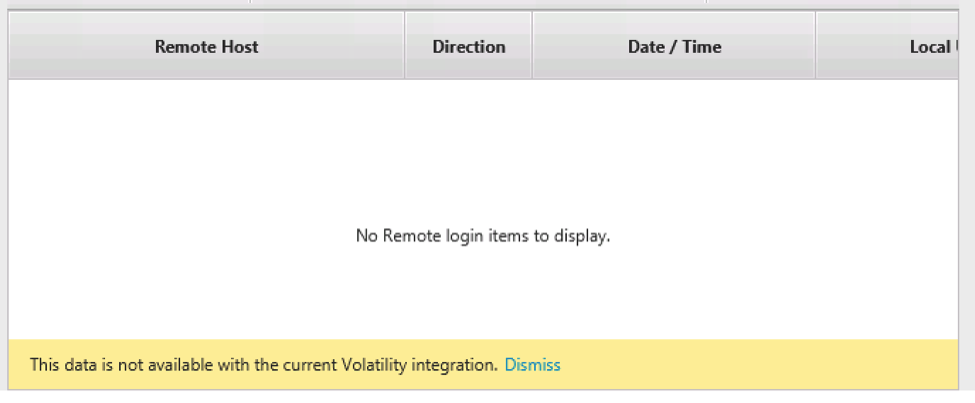
- There is some data missing compared to what you’d get from the Cyber Triage collection tool. For example, we do not always know from the Volatility output what process is associated with an active network connection or what network ports are listening.
Analyzing Memory Images
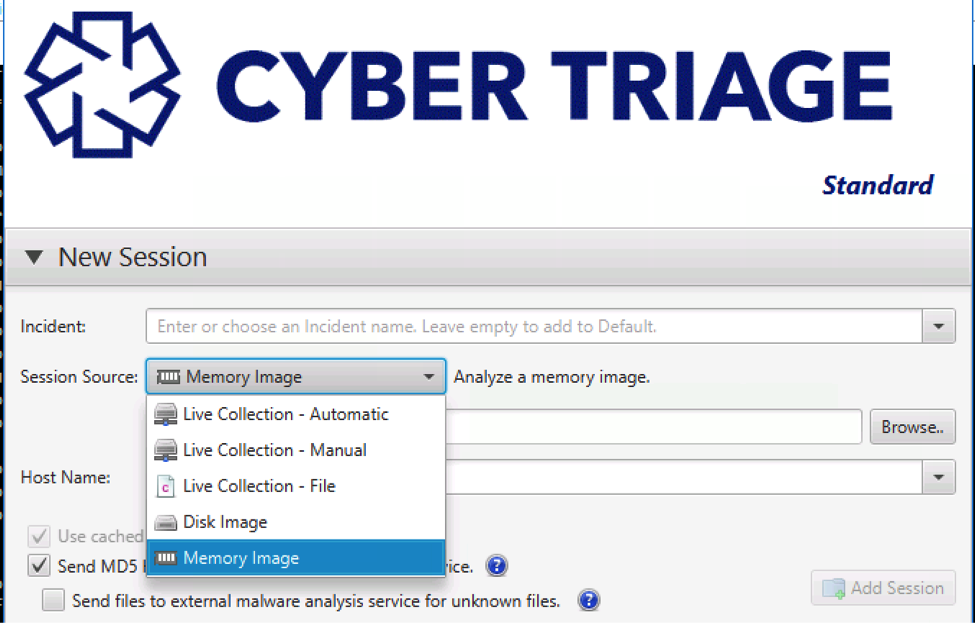
The process to analyze a memory image is much like analyzing a disk image or results from a USB-based collection. Choose “Memory Image” when making a Session.
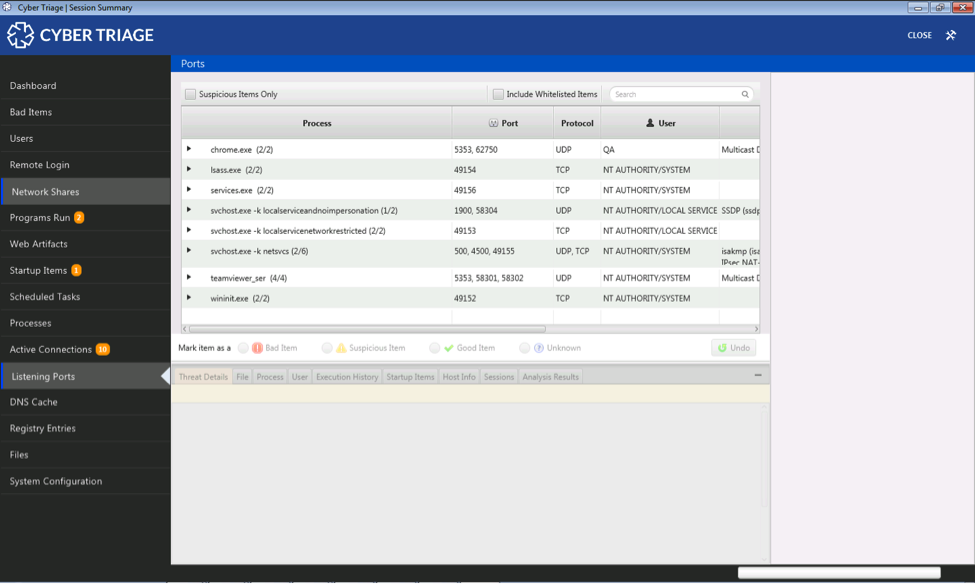
Cyber Triage will then detect the profile and run various modules. The results will be displayed in the normal Cyber Triage UI.
For some data types, you will get a dialog that informs you when data is not available from the Volatility output.
Cyber Triage needs to run many Volatility modules and each does its own analysis on the memory image. This process can take several hours.
Try It Today
Download the latest version of Cyber Triage to analyze your memory images. You’ll receive a 7 day trial of Cyber Triage’s full features that also allows you to do remote agentless collections of endpoints. After the 7 day trial, your account will be reverted to the free Cyber Triage Lite offering.
Try Cyber Triage today to make your responses more efficient.