Finding evidence of running malware is critical in DFIR, and this 7th post in my “Intro to Incident Response” series focuses on that.
We’re going to cover how malicious code gets into memory, explain how it avoids detection, and provide a quick tour of using Cyber Triage to analyze malware-related data. By the end, you’ll have a good grasp on how to detect running malware during an incident response investigation.
Let’s get started!
Jump to…
Series Recap
Why Do We Look for Running Malware?
How to Find Suspicious Processes
What to Look For
Where To Find The Data
How To Analyze The Data
Finding Running Malware with Cyber Triage
Conclusion
Series Recap
If you’ve been reading the series so far, you’re an expert at this. But, let’s review the main concepts.
This series is about both a framework for approaching investigations and specific techniques. We are breaking up the general “Is this computer compromised?” question into three (still big) questions:
- Is there suspicious user activity (such as sensitive files being accessed)?
- Are there malicious programs (such as malware)?
- Are there malicious system changes (such as relaxed security settings)?
And each of those three questions is broken into smaller questions. Eventually, you get to questions that can be answered with data.
At post #7 in the series, we’re looking at malware in bullet #2.
In our last post, we broke up our question of “Are there malicious programs on this computer?” into three smaller questions:
- Are there suspicious programs that start based on some trigger (such as when the computer starts, a user logins, scheduled task, etc.)?
- Are there suspicious processes currently running?
- Are there remnants of past executions of known malicious programs?
In other words, we’re going to look at what programs get started, what programs are currently running, and known traces we can find.
The last post focused on malware persistence, and this post focuses on finding running malware during incident response.
Why Do We Look for Running Malware?
As covered in previous posts (and is IR 101), malware is part of a lot of investigations. There are two main reasons why we try to detect malware when its running (versus when it starts, etc.):
- Malware does a lot of things to blend in. So, we should consider as many ways as possible to detect it
- Some malware doesn’t persist. When the computer is rebooted, the malware is lost. For those kinds of malware, detecting it by analyzing the autoruns, scheduled tasks, etc. is not going to be effective.
How to Find Suspicious Processes
Before we dive into specifics on how incident responders should finding running malware, we need to cover some basics on processes and malware. A HUGE disclaimer is that days and weeks can be spent understanding malware and its detection.
So…this is a very high-level overview.
What is a Process?
When you launch a program (such as by double-clicking on a .exe file) or start a service, Windows will:
- Copy the contents of the executable file (i.e. the .exe file) into memory. The executable file contains computer instructions and data
- Load supporting libraries (such as .dll files) that contain computer instructions. These libraries have features that many applications need, and the applications share common code instead of each having their own copy
- Start a thread that executes the first computer instruction from the .exe file and continues to execute instructions based on the control flow of the program. Instructions from the libraries will also get executed at some point.
When a process is running, it can create additional threads. Threads allow a process to be executing different sets of instructions at (basically) the same time.
As an analogy, let’s take a book and equate the words in the book for computer instructions.
When the process starts, it goes to Chapter 1 and reads the first word. One of the instructions in Chapter 1 could be to create a new thread and have it start on Chapter 3. Now we have the original thread reading Chapter 1 (and it may continue to loop forever in that chapter) and another in Chapter 3. Each of these can make additional threads and jump around chapters.
NOTE: This analogy falls apart because processes don’t execute sequentially like you read a book. They constantly jump around, but it was the best analogy I could think of.
A process is made up of the instructions and data that it has in its memory.
How Malicious Code Gets Loaded
There are many ways for malicious code to get itself into memory and run. Let’s look at some of those.
Explicitly Started
The most basic way to get a malicious process is to trick the user into directly running it (such as via an email attachment), adding it to the RunOnce key to start each time the computer starts, or through any of the other persistence methods that were outlined in the last post. This is malware 101.
This also includes “fileless” malware that stores PowerShell scripts in registry keys that get executed based on some trigger. In that case, the PowerShell script is the malicious code.
Trick Another Process to Start It
The problem with having malware explicitly started is that it is a well-known approach and is often looked for. So, some malware tries to do more sneaky things, such as tricking another process to start the malware.
A process can create another process by running a specific computer instruction and specifying an executable file (.exe) to launch.
The file can be specified using a full path (such as “C:Windowssystem32cmd.exe”) or a partial path (such as “cmd.exe”). If the original process is not careful, it may launch the wrong file. This is a general category of path interception and allows malicious code to be started by an innocent (but insecure) program.
For example, a process may launch “cmd.exe” and not specify the full path. An attacker may put their own “cmd.exe” file in such a place that the innocent process will launch it before the official one. Other techniques exploit how Windows deals with spaces in the name in unquoted paths.
Once the malicious program is launched, it may, in turn, launch the expected program (i.e. C:windowssystem32cmd.exe) so that the original program continues to operate as expected.
Trick Another Process to Load It
A variation on the previous idea is for the malicious code to be in a library and trick an innocent process to load it at startup.
This technique is often called DLL injection on Windows.
If you recall from the previous section, when a process starts, it will locate and load library files that have the functionality needed by the process. With DLL injection, the attacker creates a malicious library with the same name and API as the good one. The program loads the malicious library and it, in turn, loads the good one and it will call the good one as needed to do the operations that the original program wants.
The malicious library is basically a proxy for the good library.
Exploit Unchecked Inputs
Another way to get malicious code into memory is to push it into an insecure process that is already running.
Processes get input data from a variety of sources, such as reading from the network or files. They should be doing validation on it to make sure it is what they expect. But, some processes can be tricked into executing instructions that are passed in.
With this approach, there is (initially) no on-disk library or executable file with malicious code. It is all in the memory of the exploited process. But, the attacker may want a method of persistence after exploiting the process and may install additional forms of malware that store files or scripts.
How Malicious Code Avoids Detection
In the last section, we covered how malicious code can first run and get into memory. Now, let’s talk about some of the things it can do to stay running after it starts and avoid detection.
Run as Normal
Sometimes malware doesn’t do much to hide after it starts, and it just continues to run in the same process.
Hide Itself
Once the process is running, it can try to directly edit data structures in the operating system to make the malicious process no longer appear in the list of running processes. When this happens, a basic review of the running processes will show only the benign processes.
Hijack Another Process
Some malware will take over an innocent process and cause it to create a thread to run the malicious code.
This means that the innocent process will continue to operate as normal, but it will have a parasite-like thread running in the corner doing bad things.
Some examples include:
- If an innocent process loaded a malicious library, the library may create a thread and run its malicious code within the context of the innocent process
- If a malicious process was launched, it may look for an innocent process that is already running and take it over. It takes it over by pushing malicious code into the other processes’ memory and forcing it to start a thread to execute it. The original malicious process can then exit and go away.
Start a New Process and Hollow It
A variation of hijacking an existing process is to make a process for the sole purpose of taking it over.
With process hollowing, the malicious process starts and pauses a benign process. When the benign process is paused, the malicious process replaces the benign processes memory with malicious code and resumes it.
The original malicious process can then go away.
What to Look For
Given all of that background, let’s look at what to look for when searching for suspicious processes that are running malicious code:
- Source Executable: There is often basic malware that doesn’t use any of the above approaches things to minimize detection. So, knowing the executable file that was used to load the process and analyzing it can be a useful first step. This will obviously not reveal anything if the process was hijacked by a malicious process. Example analysis techniques include:
- Analyzing the content of the file using static and dynamic techniques via several antivirus engines, such as those provided via Reversing Labs, Virus Total, OPSWAT, PolySwarm, etc. Yara rules can also be useful on the content.
- Reviewing the file name to see if it is similar to an official Windows process name. This is a hiding technique to avoid basic detection.
- Reviewing the path of the source executable to see if it is running out of an unexpected location.
- Reviewing the dates on the source executable to see if they are in an expected date range. For example, are they similar to other files in the same folder?
- Loaded Libraries: To detect situations where an innocent process loaded a malicious library, each of the loaded libraries should be examined for malware. This includes:
- Analyzing the contents using antivirus tools and Yara rules.
- Reviewing the path to see if an unexpected version was loaded.
- Reviewing the dates to see if they are similar to other dates in the incident.
- Memory Contents: The malicious code a process executes is in its memory space. Therefore, it can be a valuable location to analyze. Some things to consider are:
- Compare the instructions in memory with the source executable. Are they the same, or new malicious code been inserted?
- Does the memory contain signatures from known malware?
- Hidden Processes: A review of the low-level operating system data structures may reveal processes that have been modified so that they are hidden from view. This would make a process suspicious.
- Process Start Time: Did the process start at a time similar to other dates in the incident? Or, should the process have started when the computer started, yet it has a much more recent date?
- Process Owner: Is this a standard Windows process, yet is running as an unexpected user? This can happen when the attacker restarts a program or replaces it with a malicious version
- Open Resources: Looking at what files a process has open may make it suspicious. If it is writing to an unexpected file in AppData, the file’s contents should be reviewed to see if the data is from some form of password sniffing or another monitoring tool.
- Network Resources: Malware will reach out to servers to get commands to run. Detecting those outbound connections can be useful to identify which process is malicious. Some malware will also open a listening network port for backdoor connections. Reviewing the list of open network ports can reveal malicious process when an unexpected port is open.
- OS Resources: Some malicious programs use OS resources that are atypical, but their use does not mean its malicious. Examples include hooking APIs to record keystrokes or to hide data. Or, creating and checking for specific “mutexes,” which is one method that malicious programs use to know if a computer is already infected.
- Behavior Changes: If you have a continuous monitoring solution, then you may be able to compare the current behavior of a process with past behaviors. If the process is suddenly doing different network and file traffic, then perhaps it has been taken over. Or, maybe the program was simply updated and the new behavior is part of a benign feature.
Where To Find The Data
When analyzing processes, most of the data is in memory. The challenge is how you get the data.
You have three general approaches:
- Windows APIs: Use Windows APIs to query for the data, such as a list of running process, memory for each process, list of network connections, etc. This is the easiest and fastest way to get the data, but it is also vulnerable to getting incomplete data if the malicious code is hiding itself. You can get this data from command line tools, PowerShell scripts, and many other methods.
- Memory Image: Obtain a full capture of memory and parse it using memory forensics tools. There are a couple of tools that can be used for memory capture (such as Surge ) and analysis (such as Volatility). It can be slow to copy all of the memory and then parse through all of the data structures, but it often gives the most complete picture.
- Live Memory Forensics: Live memory forensics does not require a full memory image and instead reads data from memory as needed. This will be faster, but it can be error-prone because the data in memory is constantly changing as the computer runs and processes update themselves.
How To Analyze The Data
Once you have access to all of the processes and their underlying executable files and libraries, the analysis usually consists of some manual or automated process that:
- Cycles through all of the processes
- Evaluates each based on the above criteria and uses knowledge from antivirus engines, Yara rules, and other heuristics to identify suspicious files.
Like many steps in DFIR, a core challenge is knowing what is normal in an environment. That can help to more quickly identify anomalous processes and activity.
Finding Running Malware with Cyber Triage
Cyber Triage collects and analyzes artifacts associated with malware, and we’ll show you how.
The navigation menus on the left-hand side of Cyber Triage are organized based on the same ideas that this blog series uses.
The first items are all about users. The next set is about malware. The last is about system configuration.
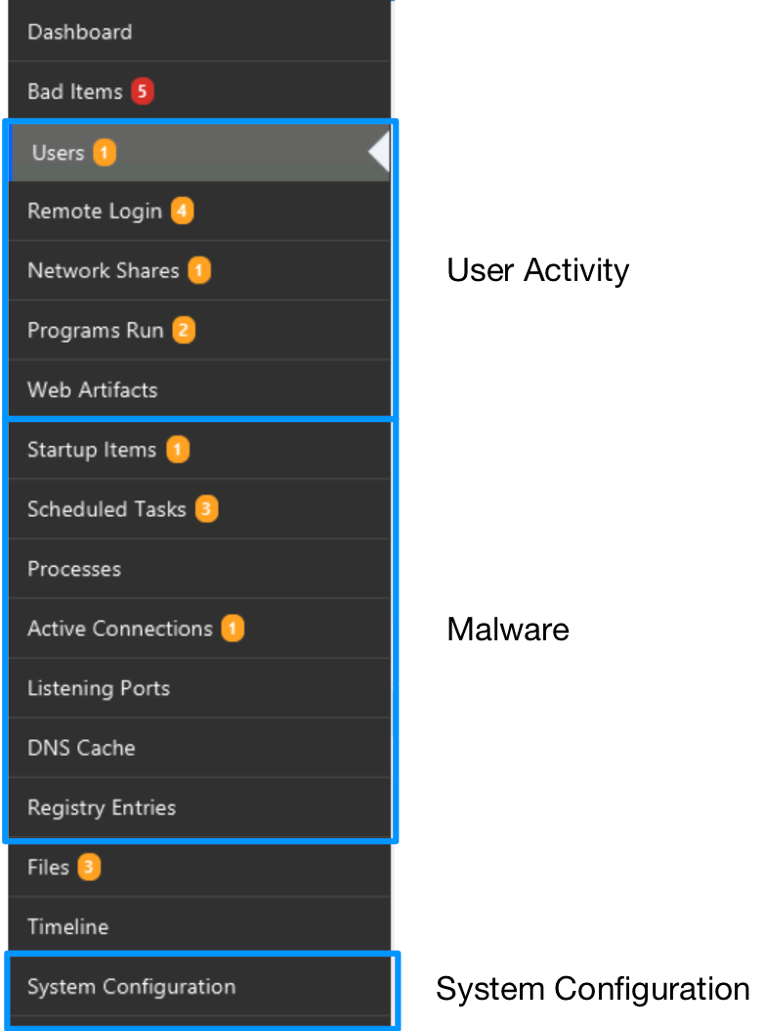
For the running process-based questions, we’re going to focus on three items in the malware section:
- Processes
- Active Connections
- Listening Ports
Collecting The Data
Cyber Triage can get data about suspicious processes from both its collection tool and a memory dump.
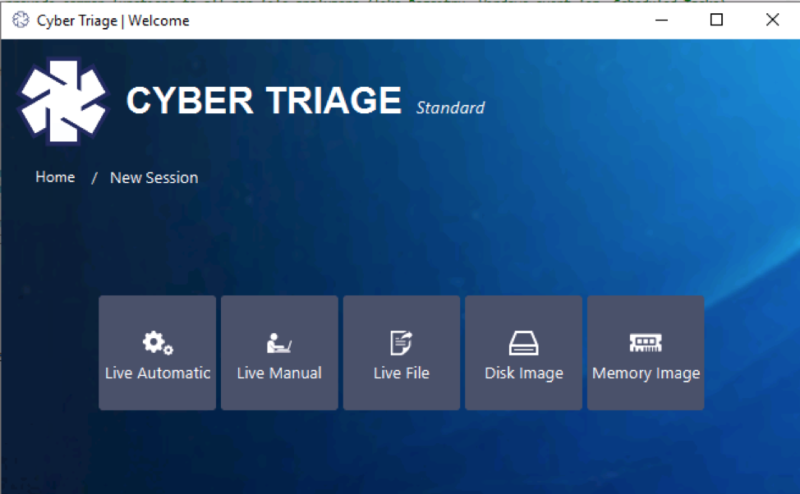
The collection tool is agentless and runs on the live system as needed. It uses Windows APIs to query for artifacts associated with running processes.
You can also import a memory dump, in which case Cyber Triage will run several Volatility modules and display the results. Modules include:
- Malfind to find suspicious processes
- PsList and SvcScan to get a list of process and services
- NetScan and ConnScan to get network connections
Processes Section
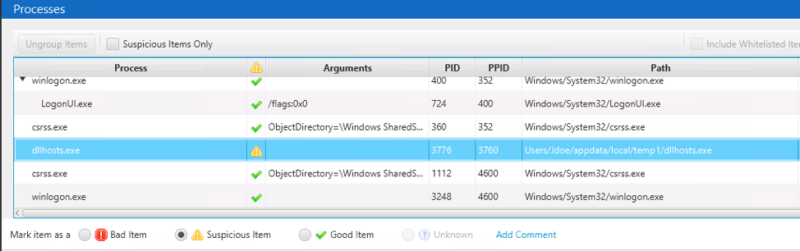
The processes section of Cyber Triage shows you the process tree that existed when the collection was made.
Its table has a row for each process (including services) and shows you which parent process created a child process:
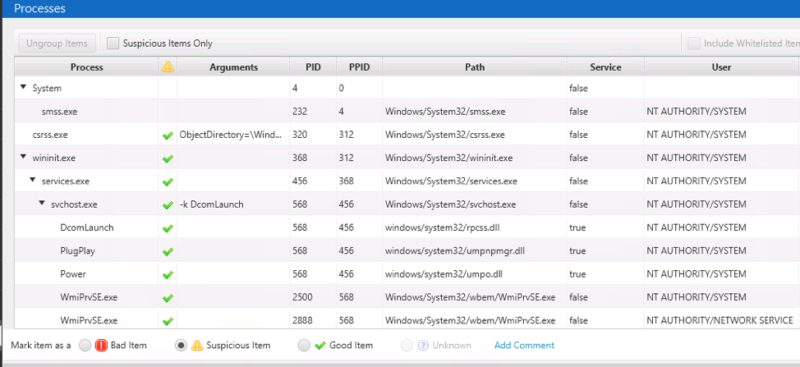
This is similar information as you’d get from Activity Monitor or PsList except that you can select a process and get a lot of details from the bottom Related Info tabs.
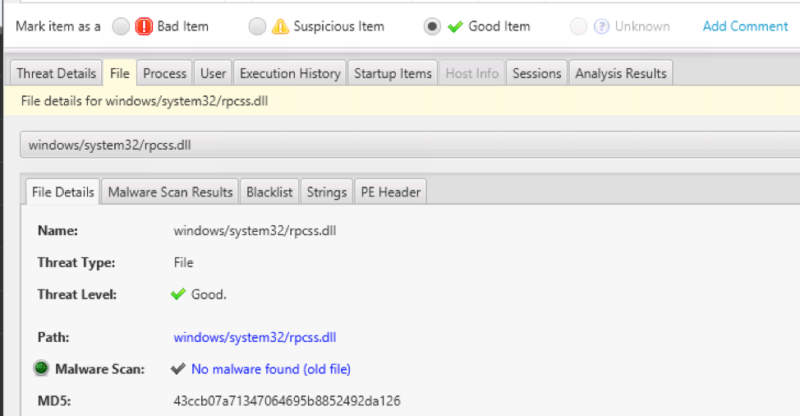
- The File tab allows you to review all of the files associated with the process and identify suspicious ones. You can see malware results from ReversingLabs, 8 NTFS timestamps, and more.
- The Process tab at the bottom allows you to get information about its network connections and open ports.
- The User tab shows you information about the user who the process was running as, including their credentials and login history. This allows you to understand at a high level about the activity of the user.
- The Execution History tab shows you how often the process has been run in the past, by using information from Prefetch and other program run sources. (See our post on investigating user activity).
- The Startup Items tab allows you to see if this process was started automatically by a persistence mechanism because it lists the autoruns, scheduled tasks, and other startup methods.
The bottom set of tabs is what makes Cyber Triage more effective than DIY and ad-hoc DFIR tools. You can start with a process and then quickly understand the files it uses, user that is running it, and how it started.
Cyber Triage analyzes the processes for the following:
- Files associated with the process are sent to Reversing Labs for malware analysis and analyzed with Yara rules and blacklists
- The process structure is reviewed, and processes with unexpected parent processes or users are marked as suspicious
- Process names are reviewed and marked as suspicious if they are similar to other known Windows processes.
Now, let’s look at an example.
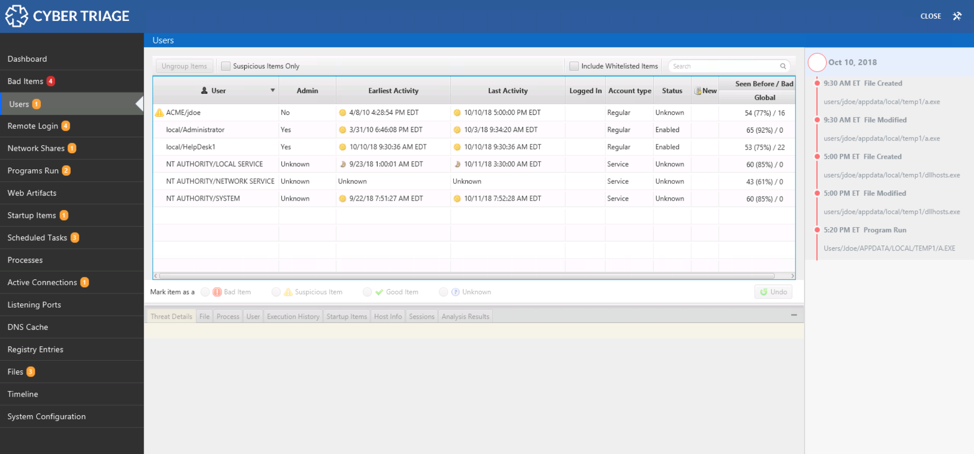
The Cyber Triage collection tool was run on a live system and the results were analyzed. A process named ‘dllhosts.exe’ was flagged as suspicious because it was similar to the official ‘dllhost.exe’ process.
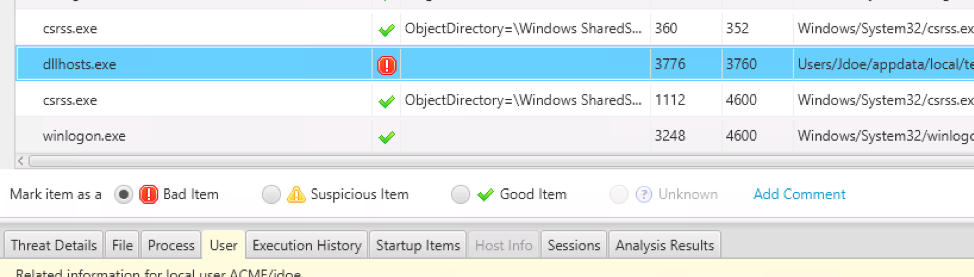
We can see it is running out of the ‘jdoe’ user account AppData folder:
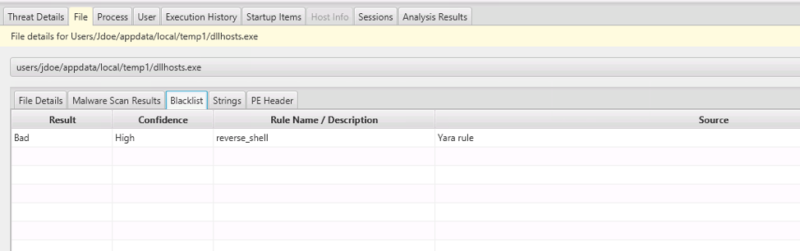
 We go down to the bottom and the File tab and see that it was also flagged by a Yara rule associated with a reverse shell:
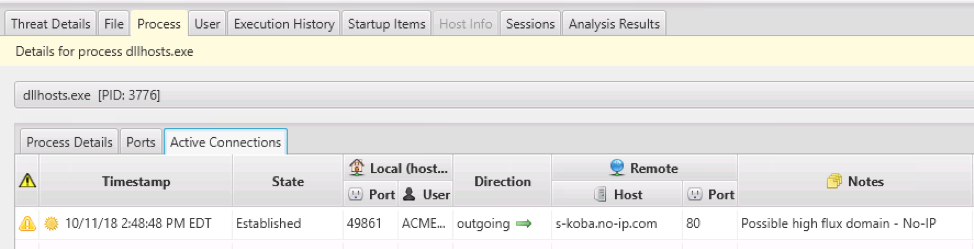
The Process tab allows us to see that it has a connection with a possible high flux domain:
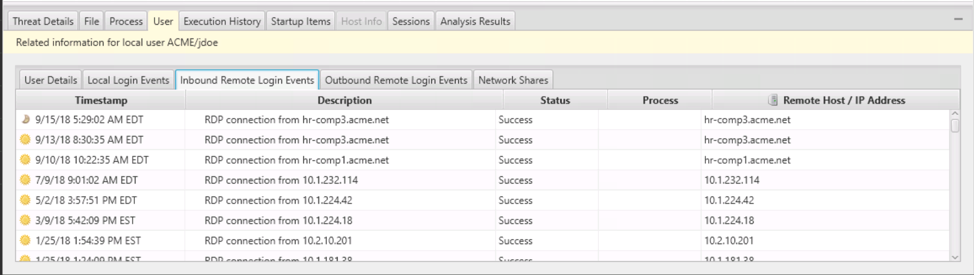
 And the User tab allows us to see the remote login history for the jdoe account:
 From all of this, we conclude that the process is malicious and mark it as Bad using the middle set of buttons:
 After marking the item, the Recommendation Engine allows you to pick which items you want to mark as suspicious so that you follow up on them (see the previous post for more details):
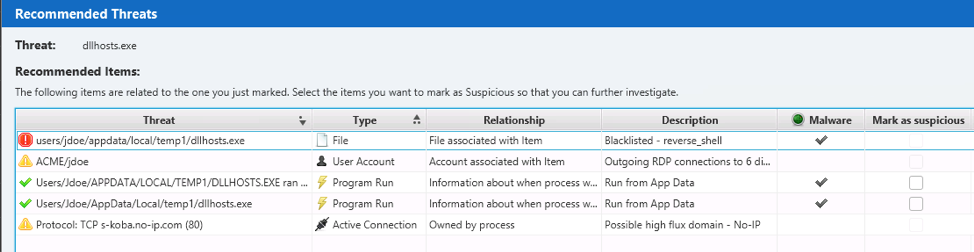
In this case, many of the items associated with this process were already marked as suspicious, but we also mark the “Program Run” entries so that they will show up in our timeline.
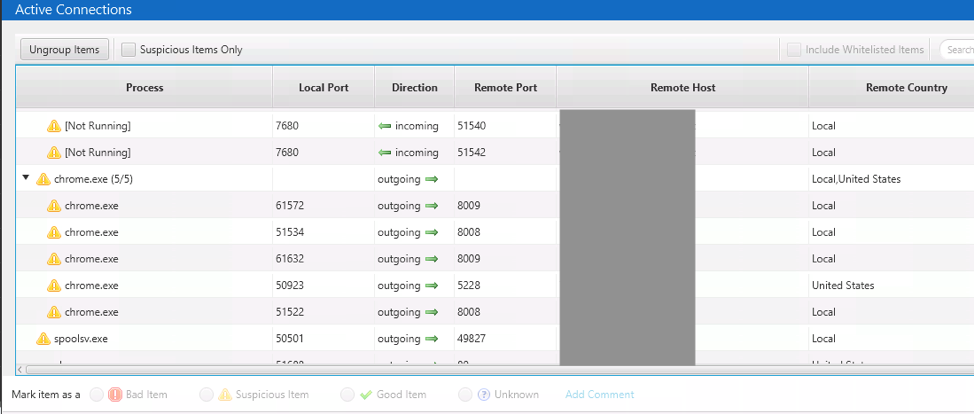
Active Connections Section
The Active Connections Section shows you the list of network connections from the time of collection. It will show you local and remote ports, local process, etc. You can use this information to decide if any connections are suspicious based on:
- The process with the connection
- The remote address and port.
The idea is that malware could be making connections to a central server for commands.
The data is organized by process to make it easier to first focus on applications that you would not expect to have network traffic. For example, Chrome or another web browser may have many network expected connections, and you can initially ignore them to focus on anomalies.
The Country (as known by MaxMind GeoIP) is also given:
Like the other parts of the Cyber Triage interface, you can mark connections as Suspicious or Bad from here and see related information about its associated process and user.
Active connections are marked as Suspicious based on:
- The remote port number.
- The remote host IP. You can use blacklists such as OpenPhish and Cyber Triage evaluates for dynamic DNS and high flux domains.
Listening Ports Section
Lastly, the Listening Ports section lists the TCP and UDP networking ports that are listening for inbound connections. These could have been created by malicious code as a way to give the attacker backdoor access to the computer:
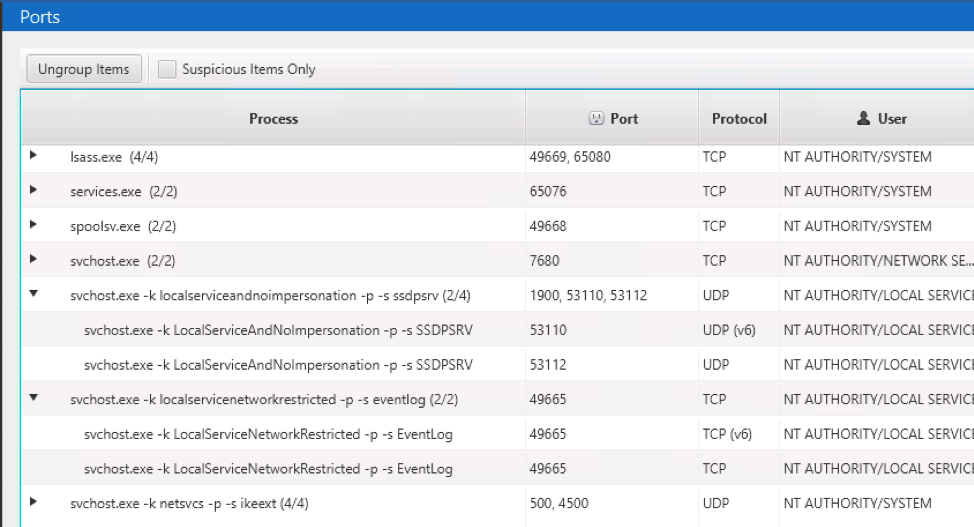
Like Active Connections, the ports are grouped by process so that it is easier to first focus on those that you do not expect to have any kind of network connectivity.
A big challenge is knowing which ports are normal in an organization, and the amount of svchost.exe associated ports makes it even more challenging to remember which “-k” is for which service.
For each selected listening port, you can mark it as “Bad” or “Suspicious” and then review more information about it in the bottom. The bottom will show you information about the process with the port open, the user associated with the process, the file associated with the process, etc.
Conclusion
When investigating an endpoint, it is critical to look for malware anywhere you can.
It’s important to look at the places of persistence like we previously did, and for malware as its running. In this post, we looked at the ways that malicious code gets itself running and avoids detection. Data from memory is critical for this.
If you want to try Cyber Triage to look for running malware during incident response, fill out the form here.