Cyber Triage 3.5 is out and this blog covers a few key changes that will make your investigations faster. They include reducing redundant data access artifacts, showing what source files were collected, and logon summaries to highlight lateral movement.
Read below to learn more or skip right to downloading the evaluation copy.
No Redundant Data Access Artifacts
Why It’s Needed
A typical computer will have several registry keys or MRU values that refer to the same file opening event, which we call data access artifacts. For example, when an Office document is opened, there can be at least five different places that recorded that event:
- Office MRU registry key
- Office Recents folder
- Windows MRU registry key
- Windows Recents folder
- Windows OpenSave MRU
When you are looking at raw artifacts, you’ll see these five individual entries and you’ll need to manually determine four are redundant. It’s important to always look at all places though in case the attacker removes evidence from one, but not the other.
What We Did
Cyber Triage will now detect these redundant entries and merge them into a single artifact if they have the same time stamp. This new feature will reduce the number of items you see and allow you to focus on relevant and malicious activity more quickly.
When To Use It
Data access artifacts are useful for many types of investigations:
- For an intrusion case, you can use them to identify what files an attacker was looking at.
- For an insider threat case, you can use them to identify what files an employee was looking at outside of their responsibility.
How To Use It
You don’t have to do anything to leverage this feature. Simply load data from a live or dead system into Cyber Triage and let it do the processing. With the latest version, you’ll have fewer items in the “Data Accessed” section.
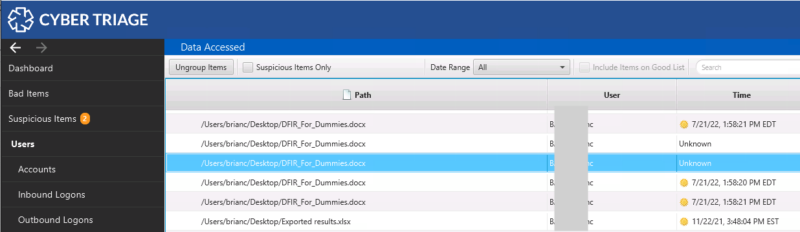
In this example, a previous version of Cyber Triage showed five artifacts for the Office document being opened:
Now fewer instances are shown.
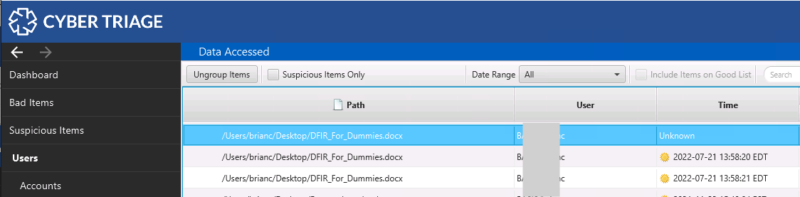
The reason that there are still three instances shown is because:
- Some of the artifacts were created one second apart and the merging requires an exact time match.
- Some of the artifacts do not have a time stamp and they are not merged with artifacts with times because Cyber Triage doesn’t know which event it corresponds with.
You can see the attribution details in the Sources tab. In the below image, the data came from the Office MRU Registry key.
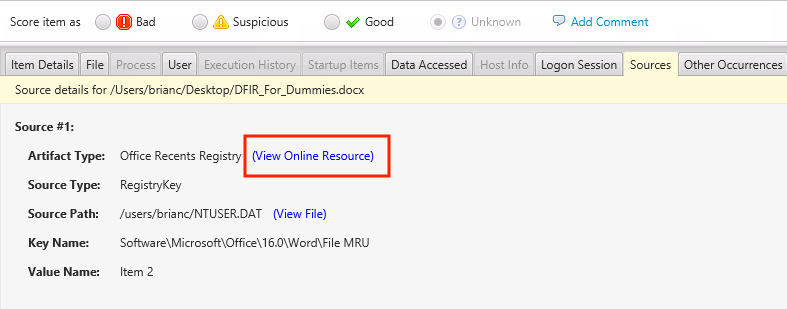
Also note that there are now links to our website that explains what an artifact, such as the Office MRU.
View All Collected Source Files
Why It’s Needed
After data has been collected from a compromised system, it’s critical that it can be leveraged as much as possible. Our users often come to us with two independent questions about collected source files, such as registry hives and event logs. They want to know:
- How to extract out all of the source files so that they can validate the findings or run 3rd party tools on them
- If Cyber Triage collected a certain file, such as an application log or configuration file
A responder may have only a single chance with a system and it’s important to leverage the extracted data as much as possible.
What We Did
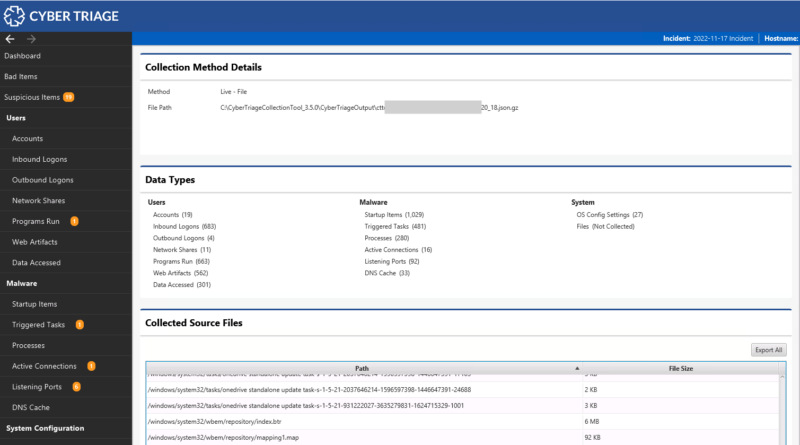
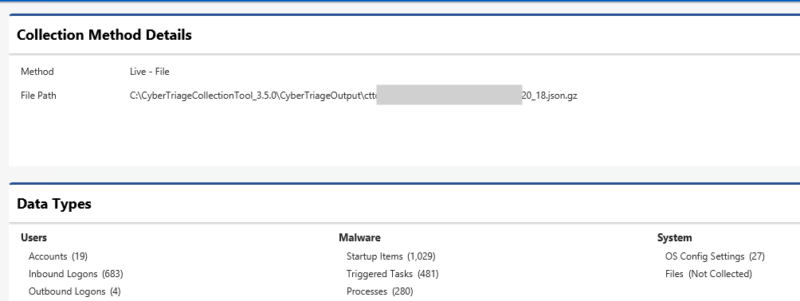
A new UI panel called “Collection Details” was added that shows you:
- Source file names and their size
- How the data was added to the incident
- What data types were specified to the collection tool
From here, you can extract all of the source files into a single folder.
This panel gives you easy access to all information about what was collected from the target system.
When To Use It
The panel can be used in any kind of investigation. The notable scenarios are when:
- You collected data from the live host with Cyber Triage and want to extract registry hives or other source files to run through additional tools.
- You are trying to trace the origin of some host data and maybe the input path for the file or image will help you.
How To Use It
Simply click on the “Collection Details” item in the left-hand side menu. The top part gives information about where the data came from and how many of each data type was collected.
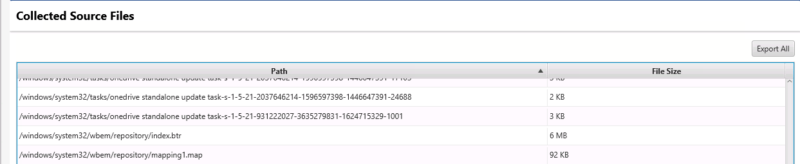
The bottom part gives you a list of the collected source files. The “Extract All” button will save all of the source files to a folder at their original relative path.
Quickly Identify Anomalous Logons
Why It’s Needed
Account take over plays a role in many investigations and one key step is to identify which accounts and hosts were used. But, it can be challenging to know which logon sessions were from the attacker (unless they simply start coming in from an IP in some unexpected country).
Identifying the anomalous behavior requires going through hundreds or thousands of historical data points to identify the user accounts that used the system and what hosts they came in from. This can be time consuming and error prone.
What We Did
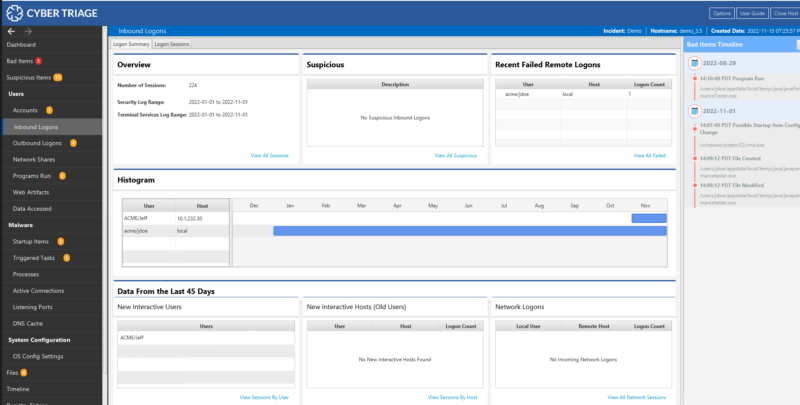
We updated the Inbound and Outbound Logon Summary panels that we introduced in the 3.4 release to more explicitly call out the types of activity that could be associated with lateral movement. Notably:
- What user accounts just started to log into this system
- What hosts did existing user accounts just start to use
- What were recent network logons (which are created from mounting drives or launching PsExec)
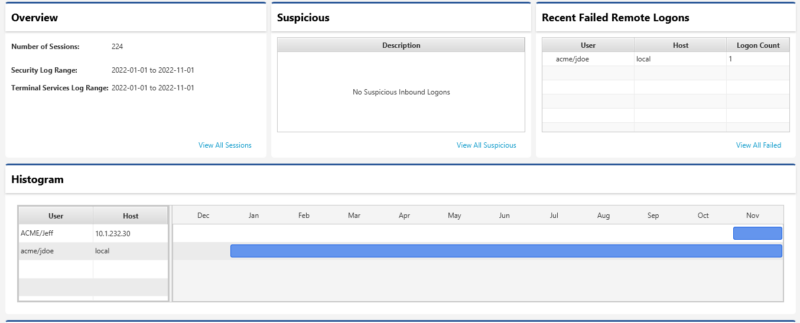
- The date range of the Security and Terminal Services log to know how much data you can expect to see
We also created a histogram to visualize the logon activity on the system.
These new panels will make it easier for you to see patterns without having to manually look at all past data.
When To Use It
You should use these panels for any type of investigation since account compromise is so common.
How To Use It
When reviewing host data, select the “Inbound Logon” or “Outbound Logon” items in the left-hand side menu. Start by reviewing the “Summary” panels. They will show you the date ranges for which there is data in the “Security” and “Terminal Services” logs. You can then review the interactive and network logons to look for any anomalies.
To dive deeper into any section, press the “View All” button, review the specific activity, and then manually score the logon session as suspicious or bad.
We’re Here to Save You Time
We are constantly reviewing user feedback and looking for ways to make DFIR responders more efficient. This blog highlights three examples, but there are others in the release and more on the way. Find the full list of changes here.
If you aren’t a Cyber Triage user yet, try the free seven-day evaluation.