In this 2nd post of our Intro to Cyber Triage™ Lite series, we’re going to talk about additional ways of importing data, namely over the network and from disk and memory images.
For those new to the series, Cyber Triage Lite is the free version of Cyber Triage and allows you to collect and view your DFIR artifacts. This series covers how to use the software.
Before we go on, here are some useful links:
- If you want to start at post #1, then you can find that here.
- To download Cyber Triage Lite, use this form here.
Getting Data into Cyber Triage Lite
There are four ways of getting data into Cyber Triage Lite during incident response investigations:
- Live File – Run the collection tool from a USB or Network drive and results are saved to the same folder.
- Live Manual – Run the collection tool and results are sent over the network.
- Disk Image – Import an E01 or raw disk image
- Memory Image – Import a memory image
There are a couple of other methods that are available in the non-Free version of Cyber Triage:
- Live Automatic – Launch the collection tool using PsExec and have the results sent back over the network.
- S3 – Run the collection tool and have the results uploaded to an S3 bucket.
- Team Streaming – A Team server can be configured to take any incoming collection tool data as long as the client has the correct secret token.
We covered Live File in post #1. In this post, we’re going to cover Live Manual, Disk Images, and Memory images.
Sending Artifacts Over The Network
Cyber Triage Lite allows you to manually launch the collection tool and send the results back to the Cyber Triage application. We call it “Live Manual”.
The most common use case for this is when the response team doesn’t have admin access on the endpoints. Such as:
- Internal teams that rely on the IT staff to run collection tools.
- Consultants who are onsite, but don’t have the admin password.
In both situations, someone with admin credentials will launch the collection tool using a command prompt or a UI (discussed later) and have the data sent encrypted over port 443 to Cyber Triage.

With the paid version of Cyber Triage, you can launch the collection tool from the Cyber Triage application, but you need an admin password on the target system.
Let’s see how to use this feature by first doing a refresher on the different parts of Cyber Triage and how to get them.
Refresher of Cyber Triage Program
There are two programs that come with Cyber Triage Lite:
- The main application that you install on your trusted analysis computer using the downloaded .msi.
- The collection tool that runs on the suspect computer that parses the local registry, event logs, and volatile memory to extract artifacts.
You can get the collection tool by pressing the “Collection Tool” button when you launch the main application.
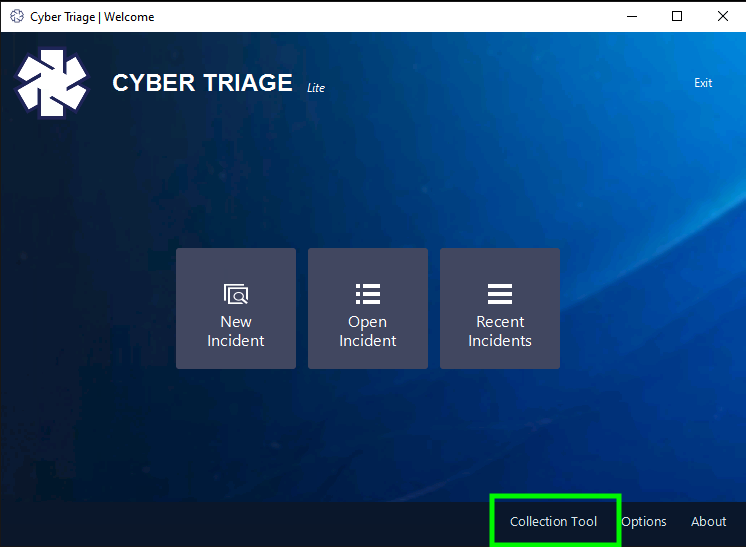
That gives you a folder with several files.
The most relevant ones are:
- CyberTriageCLI is the command line tool that knows how to parse artifacts and save them to a structured JSON file.
- CyberTriageGUI is a lite UI wrapper around CyberTriageCLI so that you don’t have to remember command line arguments.
High-level ‘Live Manual’ Process
Now let’s dive into how we use the Live Manual feature. There are three basic steps:
- In the main Cyber Triage application (the one on your trusted computer), you need to initiate the process so that it sets up the database to receive the data and opens the 443 network port. By default, the port is closed.
- Launch the collection tool and specify the hostname on which the Cyber Triage application is running.
- Review the artifacts as they come into the Cyber Triage application.
Let’s go a step lower for each of these steps.
Initiate The Process
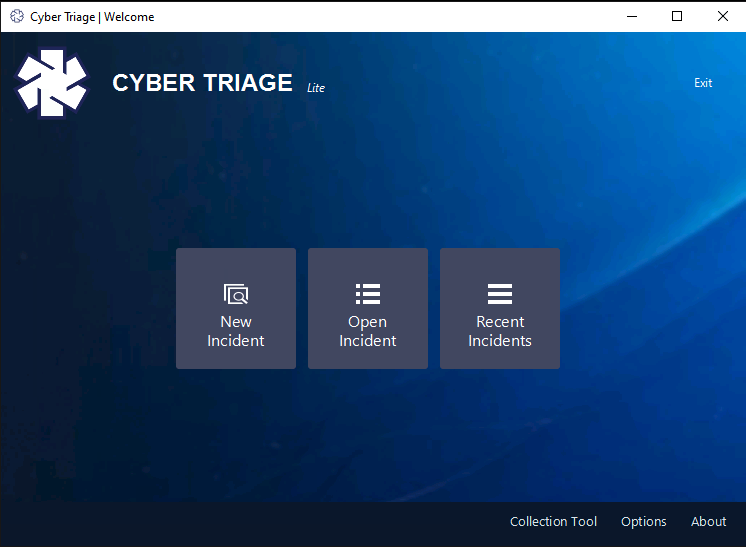
When you launch the Cyber Triage application, you’ll get an interface such as this:
All host data needs to be added to an Incident. Either create a new incident or select an existing one. And then choose “Add New Host” from the next screen.
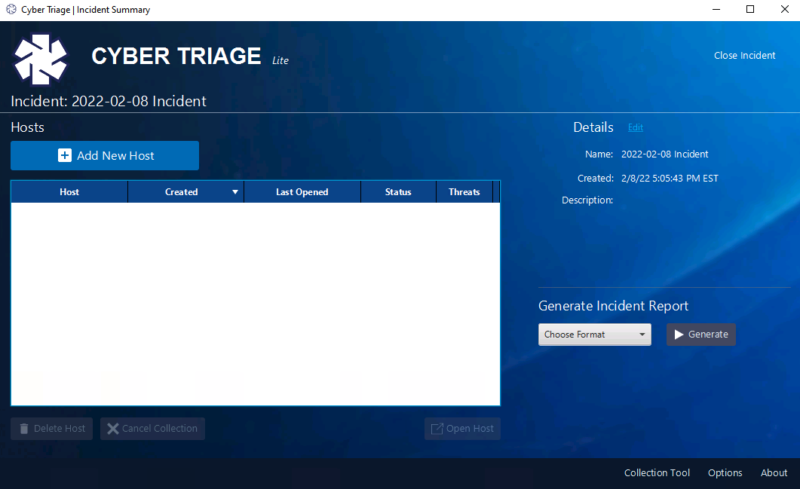
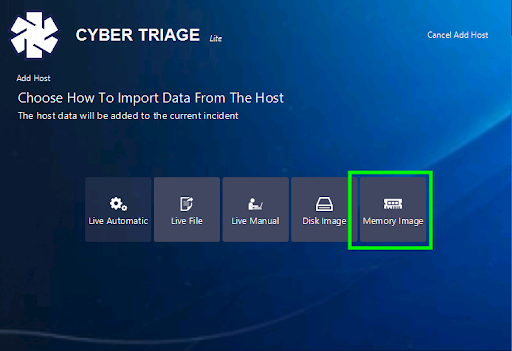
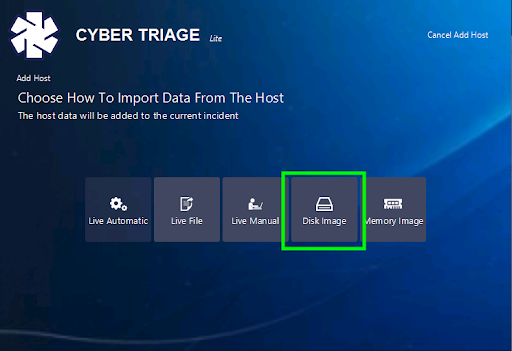
You’ll then be shown the options for adding data into Cyber Triage.
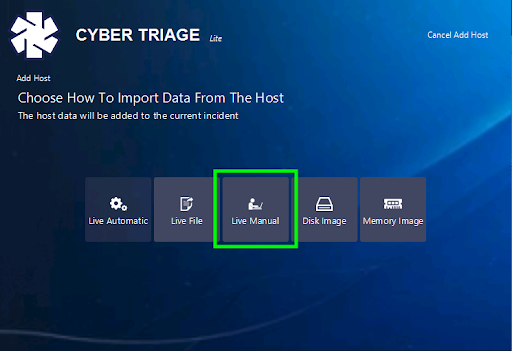
Press “Live Manual”.
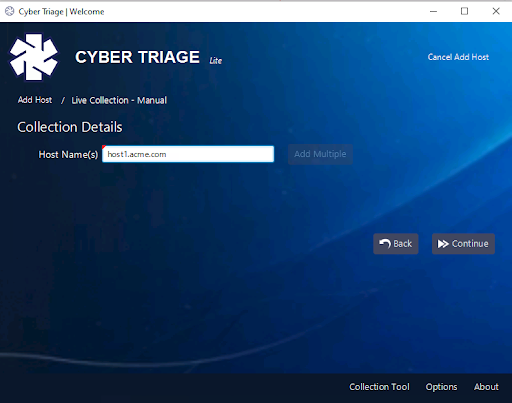
This will then prompt you for the hostname that will be initiating the connection. This will be used for the “display name” for the collection (it’s actual host name is also collected during the collection). Press Continue.
It will then give you a panel about choosing malware scanning features, which are not enabled in the Lite version. In the paid version, you can use 40+ malware scanning engines to get a broad coverage of opinions about if files are good or bad.
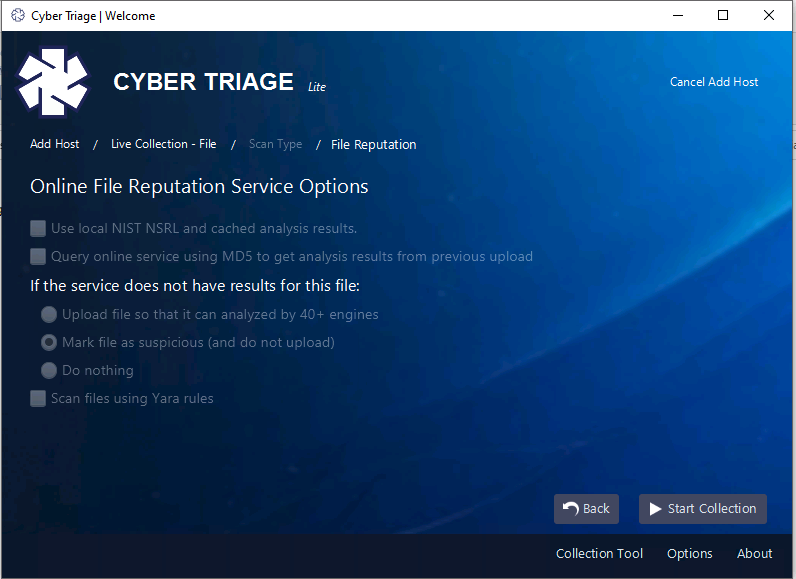
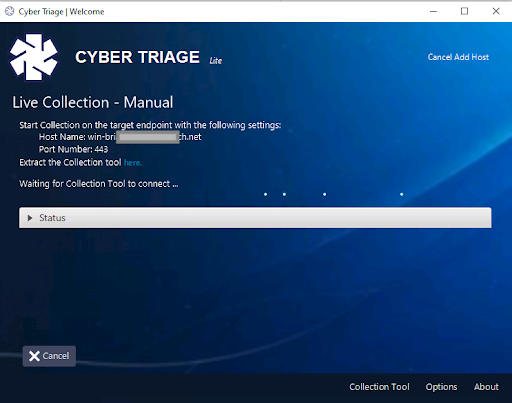
After pressing “Start Collection”, you will then be presented with a panel that tells you what info to plug into the collection tool and will wait until the connection is made.
Launch the Collection Tool
On the target system, you have two options to launch the collection tool (from the folder we showed above).
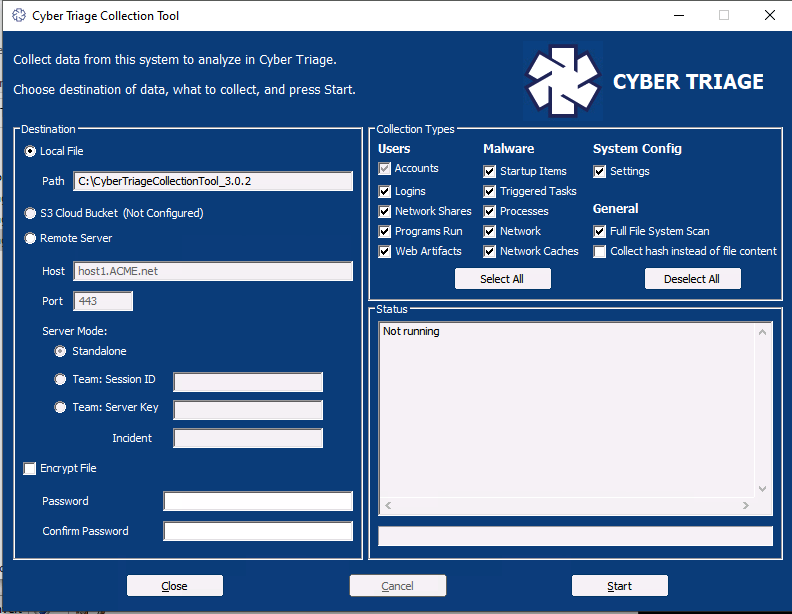
The first option is to launch CyberTriageGUI, which is the UI wrapper around CyberTriageCLI.
- Select “Remove Server” as the Destination on the left and the host name should be pre-filled in based on the computer where the collection tool was extracted from.
- You can choose what Data Types you want to collect and then press “Start”.
Alternatively, you can open a command prompt and change into the collection tool folder/drive. Supply in the host running Cyber Triage with the –server option. For example:
CyberTriageCLI –server cybertriage.acme.net
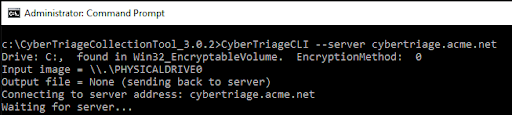
If you changed the port from 443 in the options panel, then you’ll need to specify that with ‘–port 123’.
Review The Data
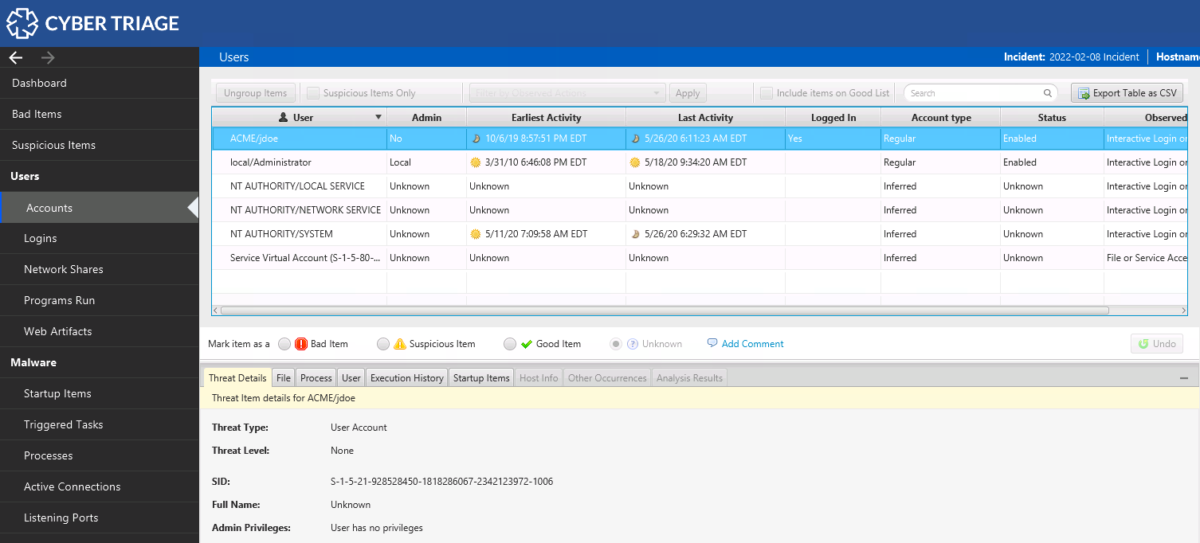
Once the collection tool makes a network connection with the computer running the Cyber Triage application, then the UI will change to the dashboard that shows the various data types from the collection.
Analyzing a Memory Image
If you have a memory image acquired from some other tool, then you can import it into Cyber Triage Lite. Cyber Triage will then run a variety of Volatility™ v2 modules to extract artifacts similar to what our collection tool does.
 It is not an exact equivalency, but it allows you to view some basic data without needing to manually run various Volatility modules.
To add a memory image, choose “Memory Image” from the methods of adding a host.
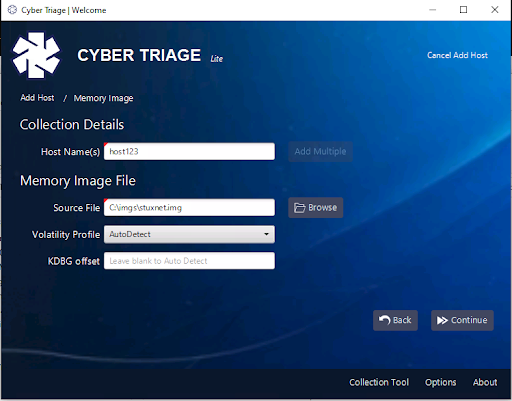
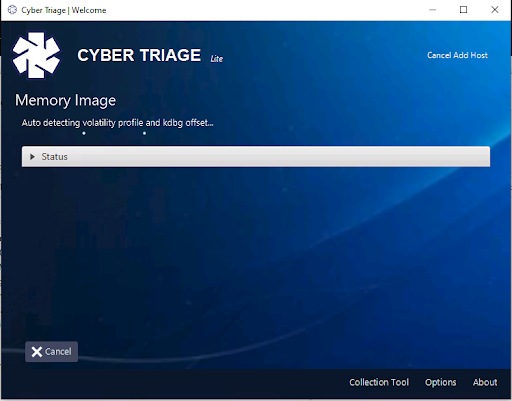
That will bring you to a panel that allows you to enter a host name for the image and the path to the image.You can specify a Volatility profile and KDBG offset if you know them or you can use the autodetect feature.
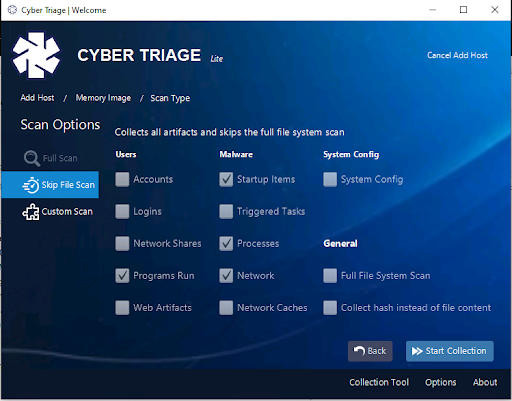
After pressing “Continue”, you’ll be given a list of data types to extract from the image. You’ll notice that many are not checked and that’s because there are not Volatility modules to extract those.
 For reference, these are the modules that we do run:
- malfind
- Pslist
- connscan
- svcscan
- sockscan
- Shimcachemem
- userassist
- netscan
- getsids
- cmdline
- Autoruns
- yarascan
After pressing “Start Collection”, Cyber Triage will start to run Volatility with the specified modules. The first pass will be to detect the profile and offset. It will prompt you if Volatility could not detect one. This can take some time.
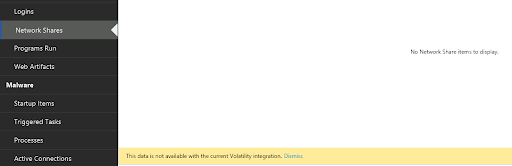
After data is extracted with Volatility, you’ll get the usual main UI of Cyber Triage. But, you’ll notice some of the data types will have a message that the data is not available from Volatility.
Analyzing a Disk Image
Our collection tool uses The Sleuth Kit when it analyzes a live system so that it can access locked files and bypass rootkits. Therefore, it can easily analyze a disk image like it can a live system.
You can point Cyber Triage Lite at a raw or E01 disk image and it will parse the file system and extract the file-based artifacts. It will of course not get processes, network ports, and other memory-based artifacts.
 The common use case for this is for law enforcement or consultants who get a disk image from a victim. This is probably the least commonly used method for Cyber Triage Lite because it has a lot of overlap with Autopsy. The paid version of Cyber Triage offers more unique value for disk images because it allows you to scan a disk image for malware using 40+ engines.
To do an image, simply choose “Disk Image” from the panel where you can pick how you add data into Cyber Triage.
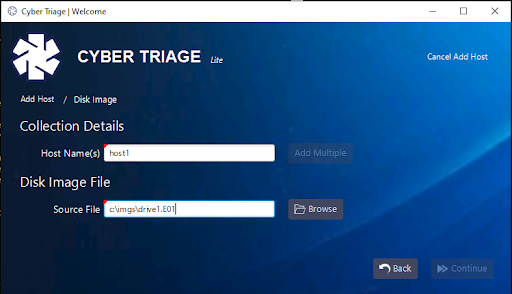
Insert the host name that you want displayed for the disk image and browse to the disk image. If there are multiple files (such as E01, E02, etc.), then pick the first.
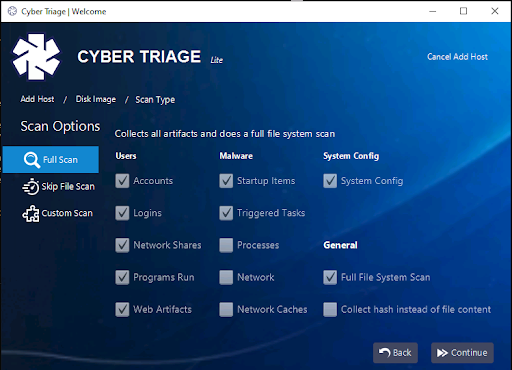
You’ll then be prompted to configure what kinds of data to parse from the image. These types were discussed in the first post of the series. By default, the entire disk will be scanned and all artifacts extracted. But, you can also choose “Skip File Scan” to focus just on artifact extraction, or pick “Custom Scan” to pick and choose specific artifacts.
After this screen, you’ll be prompted with the same malware scanning dialog that is disabled with Lite.
Pressing Start will cause the collection tool to be run and results to start to be populated.
One special caveat with importing a disk image is that the only files you’ll have access to in Cyber Triage are the ones that the collection tool extracted out. You won’t be able to navigate to any arbitrary file.
Conclusion
This wraps up on the methods that you can use to add data into Cyber Triage Lite. To try it out, use this form here. We’ll cover analysis and review techniques in the next post.
Sign up for the Cyber First RespondIR newsletter to be kept up to date on our blog posts.