When some DFIR examiners use Cyber Triage for the first time, they get a bit confused because it doesn’t line up with their traditional, manual investigation steps. They are used to running some command line tools, navigating to a certain type of artifact (such as Prefetch), and manually looking for anomalous processes.
But, when you load data into Cyber Triage, you are presented with an interface like this:
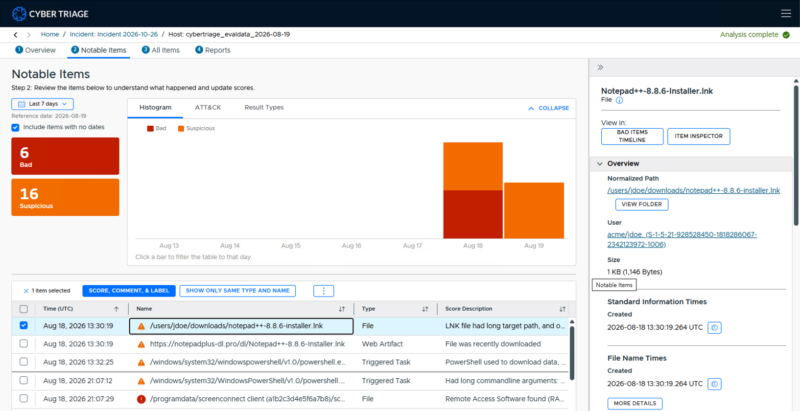
Prefetch is not front and center. That’s because we don’t think you should start with Prefetch. We think its a better use of your time to start with the scored items.
So, we developed a 4-step process to help people approach investigations using automated tools.
Main Concept: Orient → Decide → Discover
The big change with using automated tools is that your first priority becomes making decisions about what IT found. After that, then you can focus on manual discovery.
Our four steps are:
- Get a Baseline Orientation: Spend 1-2 minutes understanding the basics of this host before you try to make any decisions about events or artifacts.
- Decide on the Bad: Review the items scored as bad and identify their impact.
- Decide on the Suspicious: Use your baseline and bad item knowledge to make decisions about the suspicious.
- Fill In The Gaps and Discover: If needed, look for missed evidence based on time or tactic.

This process builds up your knowledge of the host and attack so that you can make good decisions.
Step 1: Get A Baseline Orientation
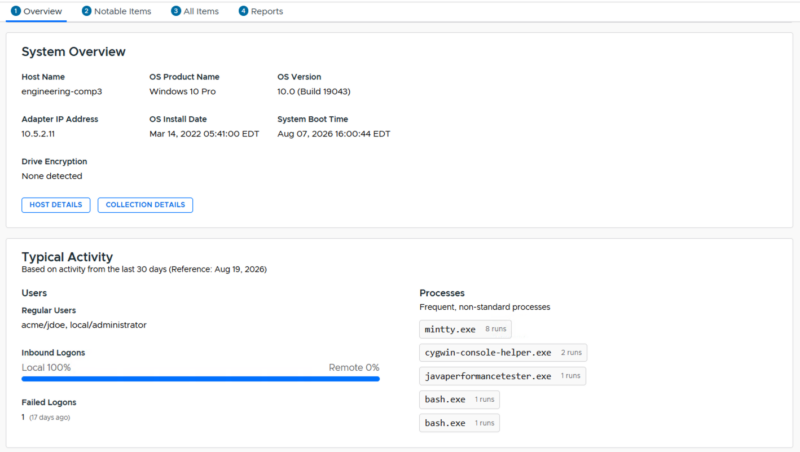
You’ve likely never seen this host before, so the first thing is basic orientation. What’s the OS? How many users? What are the typical processes?
You won’t find evidence during this stage, but it helps you build up knowledge so that you can make better decisions.
Ideally your automated tools compile this data for you and you can spend only a minute or two on this step.
As an example, this is what the Host Overview panel is for in Cyber Triage. It has OS, user, and process info:
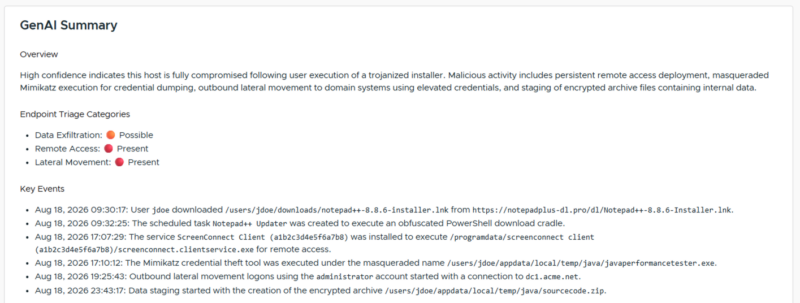
And a GenAI summary
Step 2: Decide On The Bad Items
The next best use of your time is to review the Bad items your automated tool flagged because they will give you context about what is known. These also have a low false positive rate and therefore are easier to make decisions about.
Like we covered in our past “DFIR Next Step” series, we like to think about the before and after of artifacts:
- What must have happened for this event to occur
- What could have happened after it
Knowing these can help you build up the story of the attack (if there was one).
For some investigations and roles, your responsibilities may end here if “enough bad” was already found.
In Cyber Triage, the Notable Items interface can filter on bad items for you to review.
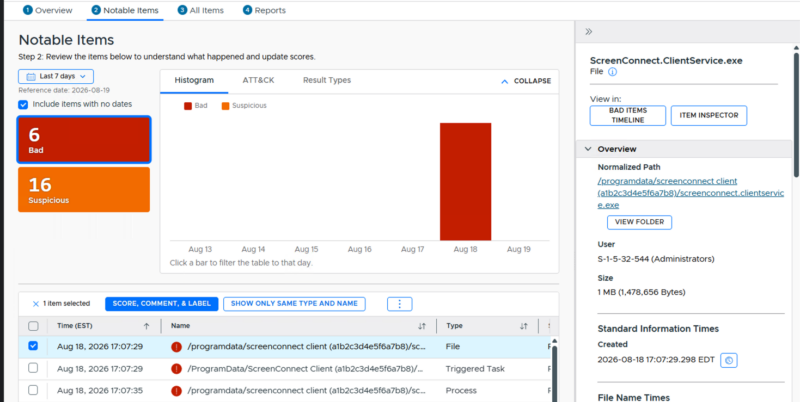
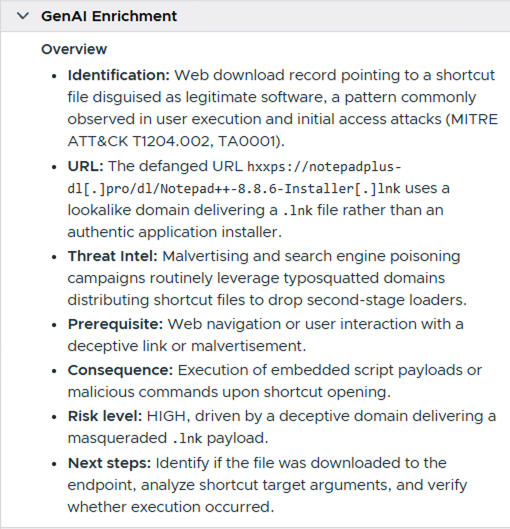
The summary panel on the right provides details of the event, including AI Enrichment.
Step 3: Decide On The Suspicious Items
Now it’s time to make some decisions by items that were scored by your automated tool as suspicious. These items could be good or bad and you need to make some decisions. But, after doing the host overview and understanding the bad items, this should be easier.
The details of deciding if a process or scheduled task are bad are a separate course. But the basic process is to consider what is normal on the system and if the activity matches other known attack tactics.
This is the same process that you’d do for the manual investigation when you look at an artifact and analyze each one. But, now you are just considering only the ones that are already scored.
You may need outside tools to help you with this. Cyber Triage has features such as:
- GenAI Enrichment
- Malware analysis
- Sandbox analysis
- Other Occurrences viewer to see where else it is
- Viewing in a Timeline to see what happened before it
- Viewing in File Explorer to see what files are near it
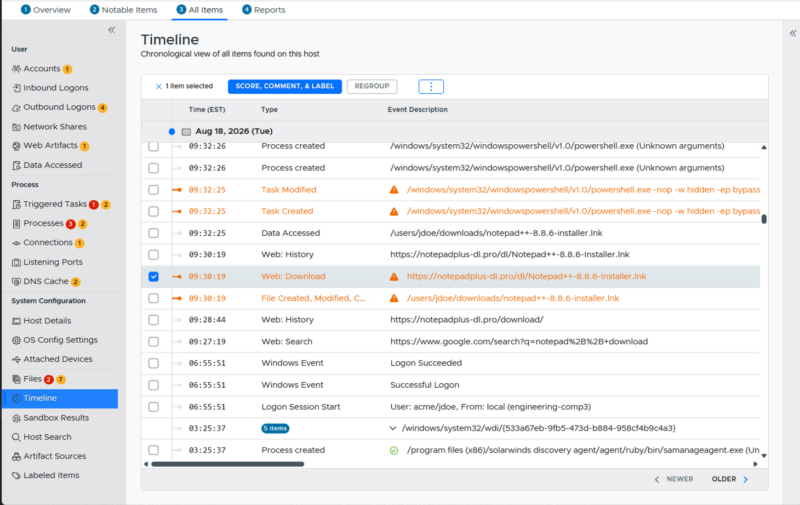
Your goal is to change the suspicious to either bad or “not suspicious”. The end result should be a more complete timeline of the attack.
Step 4: Fill in the Gaps and Discover
Once you have the timeline, you can decide if you need to proceed further for even more details. It all depends on your investigation goals.
If you have gaps that need to be filled in, then a more manual process may begin. Gaps include missing stages of an attack (maybe you are still missing initial access) or how credentials were accessed.
Using Incident-level MITRE Tactics and timelines can be helpful for this process.
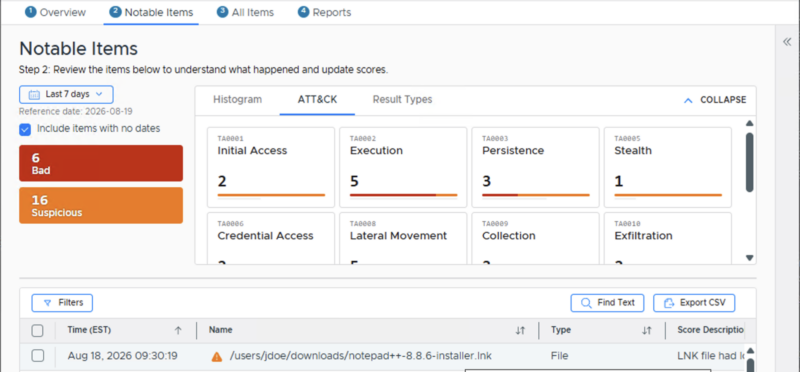
Cyber Triage has several views to allow you to manually navigate, but you still won’t see Prefetch front and center. We’re going to show you processes (which is what PRefetch represents) and allow you to navigate all of the processes, regardless of if it was found from Prefetch, event logs, or EDR telemetry.
Where to Find Prefetch in Cyber Triage
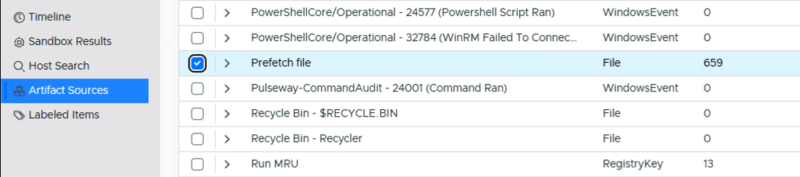
If you REALLY want to know all of the Prefetch that Cyber Triage parsed, go to the “Artifact Sources” section. There, you’ll find all of the processes that were created from Prefetch artifacts. You can see this one has 659 processes from Prefetch and 13 Data Access items from Run MRU.
Automated Investigations Are a Necessity
As attacks get faster by AI-assisted attackers, companies can’t rely on slow, manual investigations. Automation is critical and automated tools need their own process.
If you need an automated endpoint triage and investigation tool to contain attacks, try the 7-day trial of Cyber Triage. It uses your EDR infrastructure to quickly collect and analyze endpoint data so you can confidently and quickly determine the impact and scope of an attack.