There was a lot in this release (as you can see here), but I wanted to point out a few features and their background. Even if you aren’t a Cyber Triage user, you may find some of the motivation for the features interesting.
The three themes we’ll focus on here are:
- Finding malicious processes faster
- Exporting more indicators for information sharing
- Adding more OS Account attributes to make it easier to find anomalous accounts
You can download the latest version from here.
Find Malicious Processes Faster
Why It’s Needed
Attackers are constantly using new forms of malicious software to control systems. The malicious software could be the ransomware encrypting tool, a malware loader such as QBot, or a backdoor. Finding the malicious processes that recently ran is essential to investigating and understanding an intrusion. It can be challenging because the attacker is trying to blend in and the process may not be running exactly when you performed the collection.
What We Did
In the latest release. we added several changes to help you find these processes faster:
- We simplified the user experience and now have a single section that includes both the currently running process and the historical processes (what we used to call the latter Program Run). This means you can look in one place instead of two and not see overlapping information.
- We changed the interface to be more of a search-like interface with more powerful filtering. This allows you to more quickly ignore standard processes and focus on the anomalies.
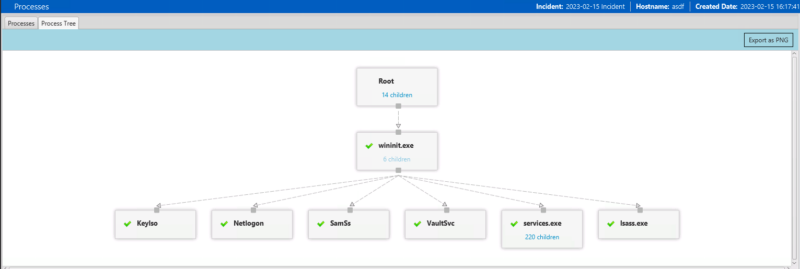
- We added a tree navigation to allow you to traverse the tree of processes when the collection tool was run (this feature does not work if you did not use our collection tool).
All of these features ensure you can more quickly focus on anomalous processes.
How To Use It
After you’ve added data to Cyber Triage using our numerous collection methods, you can look for the malicious processes under the “Process” menu item on the left. You’ll use different settings depending on what you are currently looking for.
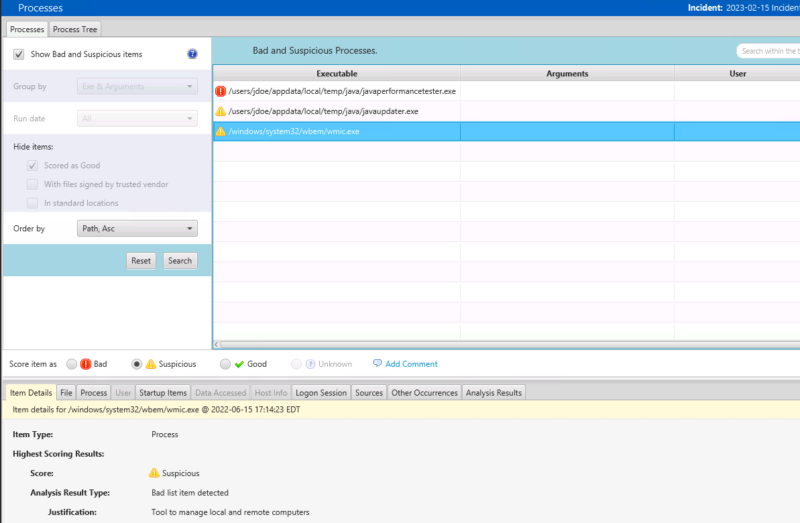
If you want to focus first on the processes marked as bad or suspicious, you can do that from the “Bad Items” or “Suspicious Items” tables on top. Or, you can get the same basic result by choosing the “Show bad and suspicious processes filter”:
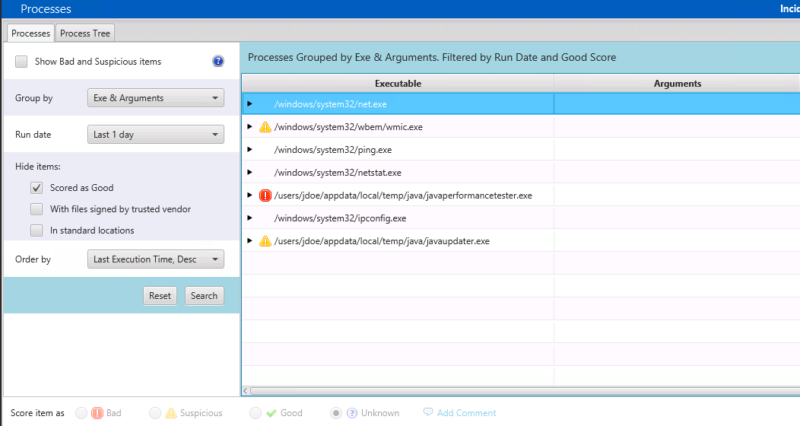
Or, maybe you want to focus on what ran in 24 hours before the collection. You can apply the “Run date” filter and choose “1 day”. Because the default filters will hide files that came back with a Good malware scan result, there is a small number of processes to focus on.
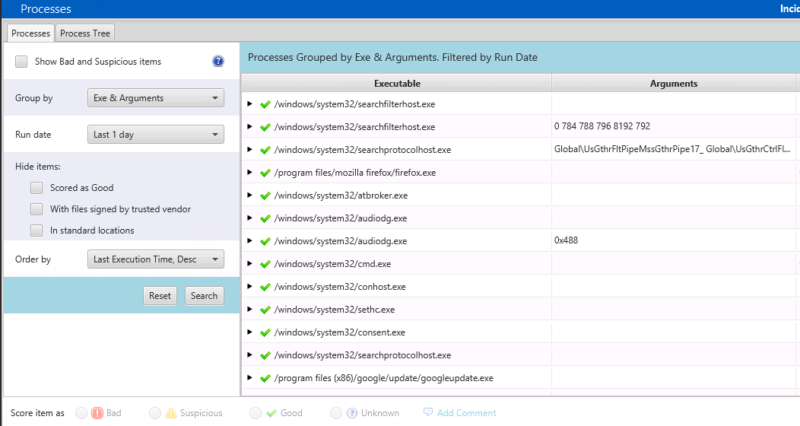
If you want to see a more exhaustive list, perhaps to see if any living off the land tools were used, you can unselect that and then see many more entries:
You could also do a search for what processes ran the most infrequently over the past 30 days. To do that, change the date filter and sort by “Instance count, increasing”. The far right column has the number of times it was launched.
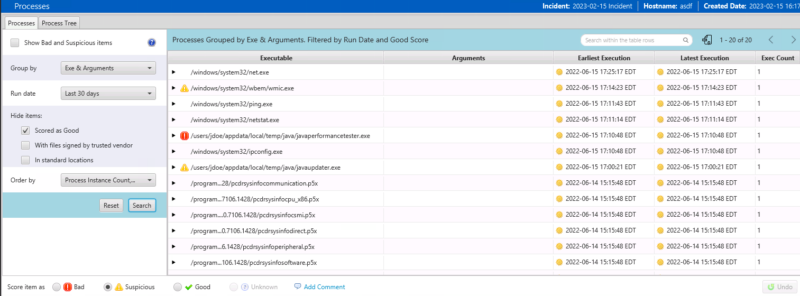
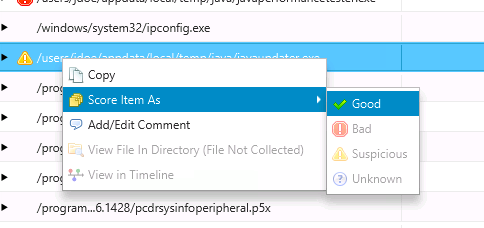
If you ever come across a set of false positives for a process running out of a non-standard path or that matches some other badlist pattern, you can always right click on the group and mark all of them as good.
Export and Enrich More Indicators
Why It’s Needed
Responders need to get data out of Cyber Triage and into other applications to fully defend a network and know its scope. Prevent tools, such as firewalls and network detection systems need to know which IPs to block and detect on. Hunting systems should know hash values for malicious software. Learning what happened on one system is only the start of fully fixing the issues.
What We Did
There are now more report modules to output data from Cyber Triage. Notably:
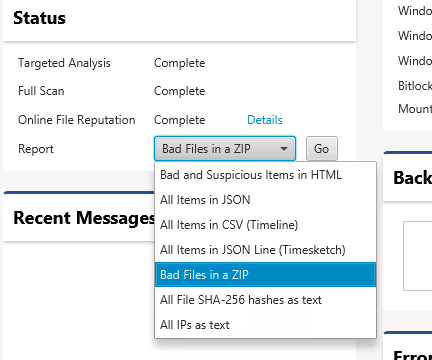
- All Bad Files in ZIP: This module exports all of the files that were scored as bad, often from malware analysis. They are put into a ZIP file that has a password of “infected”. You can use this to perform further analysis and share with reversing engineering specialists.
- All IPs as text: This module will export all IP addresses associated with the host. This includes ones directly referenced and IPs that were resolved from host names.
- All SHA-256 file hashes as text: This module will export all SHA-256 hashes of collected files so that you can integrate the results into other security systems for enrichment and correlation.
How To Use It
Simply go to the Dashboard and choose one of the reports from the pull down. That will then prompt you about where to save the report.
More Granular OS Account Review
Why It’s Needed
When analyzing different kinds of hosts, you’ll come across references to many types of OS Accounts. Not all of them will be relevant to your investigation. For example:
- Domain controllers will have references to accounts in its log files for accounts that accessed its file share, but did not have interactive access.
- Any computer can have entries for failed logins when the username doesn’t exist, either from a mistake or a brute force attack.
- Event logs can have entries for user accounts that used to exist, but no longer do in the registry.
These types of entries can be irrelevant to an investigation that is focused on who had interactive login access to the host. But, could be relevant in other scenarios.
To conduct an efficient investigation, it’s important to give the responder control over what kinds of OS Account entries are shown.
What We Did
In the latest release, we changed two fields for OS Accounts and then changed the UI.
- Accounts can now have a status of “Non-existent” if the event logs said the account did not exist at the time of the login attempt. Other status fields include “Enabled” and “Disabled”.
- The previous account type of “Inferred” has been renamed to “Unknown” to avoid confusion. Other types include “Regular” and “Service”. We used the term “Inferred” before when we saw a reference to an account that existed, but we weren’t sure what kind it was.
Both of those fields now have appropriate filters in the UI.
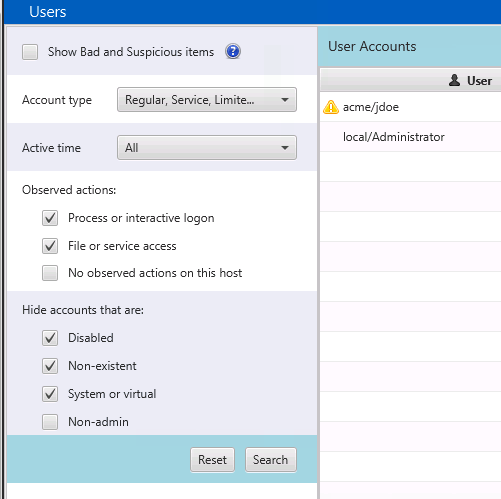
By default, Cyber Triage will hide non-existent users, but show the Unknown accounts.
How To Use It
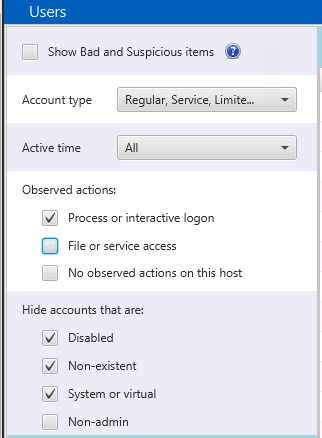
Go to the “Accounts” part of the interface and start to review what accounts had references on teh system.
- If you are on a domain controller and see too many entries and you want to focus on those with interactive logins, then uncheck the filter to show accounts with “File or service access”.
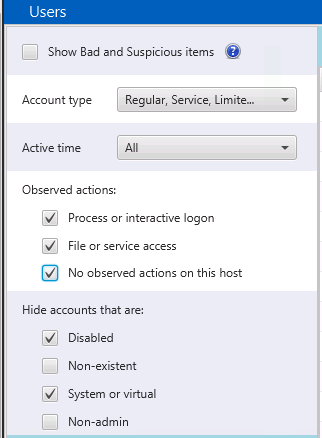
- If you want to see what kinds of failed brute force logins were attempted, then uncheck the “Non-existent” option and choose all types of observed actions.
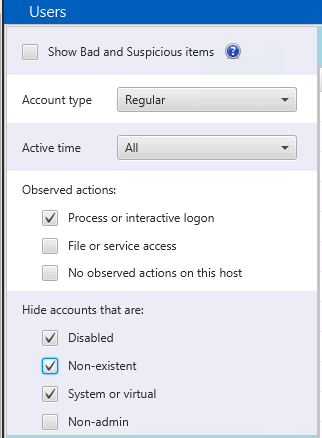
- If you want to focus only on the accounts that existed on the system at the time of collection, then you can choose “Regular” for the type and “Interactive” for the actions.
Try It Out
Every day, we work hard to make your investigations faster and easier. Download the latest version to try it out with a free 7-day evaluation.