The holidays are over, we’ve caught up on our work, and it’s time to reload the concept of the endpoint triage OODA loop back into our brains. In this post, you’ll learn how to approach the “Observe” phase of OODA during your incident response process.
This post continues the one from 6 (!) weeks ago on using the OODA loop during endpoint triage.
Series Alignment
I’m going to assume you’ve forgotten nearly everything from early December, so let’s review the basics:
- OODA is a decision-making model that is natural to many people but also formalized to help optimize processes
- It consists of four phases that continue to repeat and provide feedback. The idea is to quickly iterate through them faster than your adversary and therefore make decisions faster than they do
- There are several other articles about using OODA in incident response, but we are focused at a micro-level on endpoint triage. In other words, the process that we use to investigate an endpoint for an intrusion.
OODA is an acronym with four repeating phases:
- Observe: Observe the situation using a variety of sources that are available. You will never be able to collect all data before making your first decision
- Orient: Use your experience and training to make sense of what you are seeing. Make hypotheses about what is happening and predictions about what could happen next
- Decide: Based on your goals, orientation, and timing needs, decide on what action to take and when. Actions could include testing a hypothesis about the current state (i.e. get more data) or to try to change the predictions about what will happen next (i.e. thwart a bad guy)
- Act: Implement the decision.
The impact of the action (and at all stages) should be observed and fed back so that a new orientation can be made and another follow on decision and action.
What Can We Observe During the Incident Response Process?
Observing is all about gathering data so that you can start to make some hypotheses and decisions.
There are four types of data you’ll observe with endpoint triage:
- Trigger: The event(s) that caused you to become suspicious about the endpoint. For example:
- IDS alerts
- Help desk ticket
- Hunting results
- Scope: The investigation question you’ve been tasked to answer. For example:
- Is this host compromised?
- What application was sending network data to a blacklisted IP?
- What other hosts are compromised?
- Sensors: The collected data associated with the endpoint. For example:
- Raw data from continuous monitoring agents (EDR) or point in time collection tools (such as getting the current list of processes)
- Results from analysis tools that process the raw data (such as when an unexpected process is flagged)
- Network traffic related to the endpoint
- Historical Data: Data from previous states of this and other systems that can help determine anomalous data. For example:
- Baseline image that was used to build the computer
- Data collected from other endpoints in the enterprise
- Threat Intelligence: Data being shared about attack trends and indicators of compromise. For example:
- Latest trends about how attackers are gaining access to networks
- Lists of files and IP addresses being used by attackers.
As the OODA loop cycles, it’s often the sensor-based data that continues to grow as the responder collects more and more data from the endpoint.
How Can You Get The Data?
The biggest challenge for most companies is getting access to the data so that they can observe. A well equipped SOC will have easy access to historical data from any endpoint, the network, and threat intelligence feeds. Queries can be performed to start pulling all of that data in.
But, most companies don’t have that luxury.
Most companies don’t have remote visibility into their endpoints or the ability to quickly do network captures. So, let’s review what companies can do to get those capabilities.
Endpoint Visibility
Endpoint visibility is critical to endpoint triage!
You can’t answer endpoint-related questions without endpoint data.
Ideally, you’ll want visibility with the following characteristics:
- Long-Running: Activity from attackers occur at different times. If you have only a single point in time collection from a host, it may miss events that happened before and after it. It’s best to have the capability to monitor the host over a long period of time or at least be able to easily go back and get more data
- Triage: You don’t have time to look at all the data. You need your technology solution to collect only relevant data. And, you certainly don’t need a full disk image for most scenarios
- Remote: You need to be able to see what is happening on the system from afar. Some scenarios require you to use a USB drive to collect data, but that can slow the response and make it so that you can’t tightly integrate with your orchestration system
- Automated: Your software should be doing the tedious work and you should be focusing on the hard problems. The needed data should be automatically collected and analyzed so that you can focus on observing the suspicious data only.
Many companies start by remote desktopping into endpoints, running command-line tools, and reviewing the results. They then realize they need to scale and look at remote access tools that automate the analysis. Still others move towards continuous monitoring with EDR solutions.
Our Cyber Triage product remotely collects a subset of the endpoint data (i.e. triage) and performs automated analysis on it. It is currently a single snapshot in time, but we’ll be releasing a version this Spring that continues to run and collect data.
Network Visibility
It can be important to watch what an endpoint is sending over the network. So, it can be useful for a response team to have network monitoring capabilities ranging from:
- Full package capture of all content to and from a given endpoint
- Logs from a firewall or web proxy to show destinations and times.
Full packet capture can be challenging depending on where the endpoint is. For example, if it is at a remote or home office.
Historical Endpoint Data
The next phase of the OODA loop is to orient and that requires understanding what is suspicious and not normal. Having historical data can make that easier. Here are some examples:
- Baseline: Some enterprises start off with a baseline image that all computers are created with. If you have such an image and the capability to compare that with the current state of the system, you can identify what has changed and focus on those to see if they changed from updates or were malicious
- Frequency: Sometimes, there are too many variations on computers to have a baseline. But, knowing the frequency of occurrence of an item can help you determine if the item is very common or rare (and therefore more suspicious). This capability is typically a feature of your endpoint triage tool.
Cyber Triage will show you what’s changed on a given endpoint since the list time it was collected from and shows you how common or rare each item is in your environment.
Threat Intelligence
Threat intelligence allows you to not be analyzing the endpoint in isolation. You can leverage the work of others who have already identified threats. Threat intelligence can help with:
- Analyzing files to see if they contain malware
- Searching for file hashes and names from past incidents
- Looking for traffic to specific IP addresses or domains.
You can get access to threat intelligence by subscribing to a service or it may come bundled with your product.
Cyber Triage includes a subscription to Reversing Labs to provide you with access to 40+ malware scanning engines. You can also import data from OpenPhish and other threat intelligence providers.
Risks of Not Having Visibility
If you don’t have access to the previously listed types of data, then you risk not being able to make sound decisions. You’ll be making hypotheses about what is going on without being able to get additional data to confirm or deny them.
The impact of this is that you may miss evidence and then incorrectly conclude that either the system was never compromised or that you’ve eradicated the attacker.
Example Scenarios of Observing in the Incident Response Process
Let’s tie all of this back into the past Intro To IR Series now. That series was all about breaking up a big question, like “Is this computer compromised” into smaller and smaller questions that could ultimately be answered by data that we can collect (i.e. observe) and reason about (i.e. orient).
We’ll use these same two scenarios throughout this OODA series, and we’ll use Cyber Triage as an example visibility tool.
Suspicious Network Traffic
Here is the scenario. You have a Network IDS that generates an alert because of network traffic to a suspicious IP from a laptop. You’ve been assigned to investigate and answer the question “Why did the laptop send network traffic to the remote IP”?
We’ll break that into a smaller question of “What process sent network traffic to the remote IP”?
So, let’s list out what we can observe:
- Trigger: We saw network traffic and alert. We know the local and remote port numbers used
- Scope: We’re looking for processes and active connections
- Sensors: We do not have continuous monitoring on the laptop. So, we’ll need to collect data from the laptop using Cyber Triage
- Historical: We have not collected from this host before, but we do have data from other computers stored in the Cyber Triage database
- Threat Intelligence: We have access to IP reputation service via our Network IDS and file reputation via Cyber Triage.
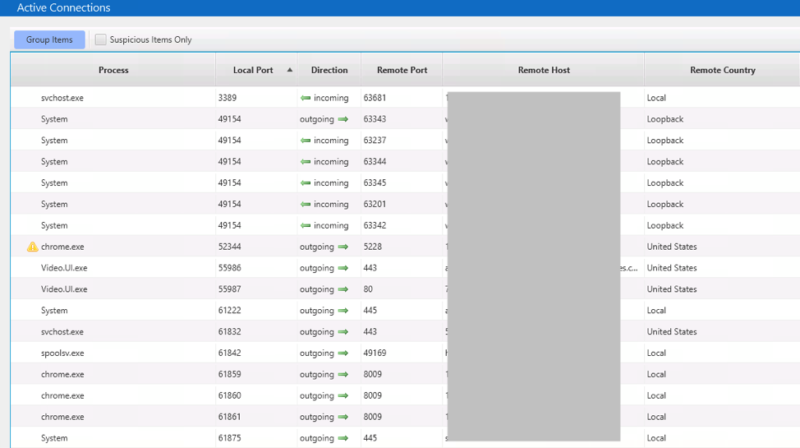
We remotely deploy Cyber Triage to the laptop to collect active connections:

When the data comes back, we can observe it in the Cyber Triage UI. We look for active connections to the suspect IP and (as expected) do not see any:
We will likely decide (the D in OODA) to increase our scope to look for other evidence of malware. So, you’ll collect all data types associated with malware starting, running, and its remnants. We could have collected those data types in the beginning given that it is always likely that the connection to the bad site will not be active at a single point in time.
We could also deploy a continuous monitoring solution to stick around and get more data about network connections.
Compromise Assessment
Many of our consultant users perform compromise assessments for companies to hunt around for intrusions. They are trying to answer the question of “Is this computer compromised?” As we discussed a lot in the last series, that is a hard question to answer and needs to be further broken up into the many smaller questions about malware and users.
The goal here is quick loops. So, I’d propose first focusing on the questions that are easy to answer. Such as:
- Is there known malware as startup items or triggered tasks (scheduled tasks, WMI actions, etc.)?
- Are there unexpected user logins?
Let’s map out what the initial “Observe” phase would look like:
- Trigger: None
- Scope: Malware persistence and user logins on CEO’s computer
- Sensors: We have no data. So, we’ll need to collect data from the laptop using Cyber Triage
- Historical: We have not collected from this host before, but we do have data from other computers stored in the Cyber Triage database
- Threat Intelligence: We have access to file reputation via Cyber Triage.
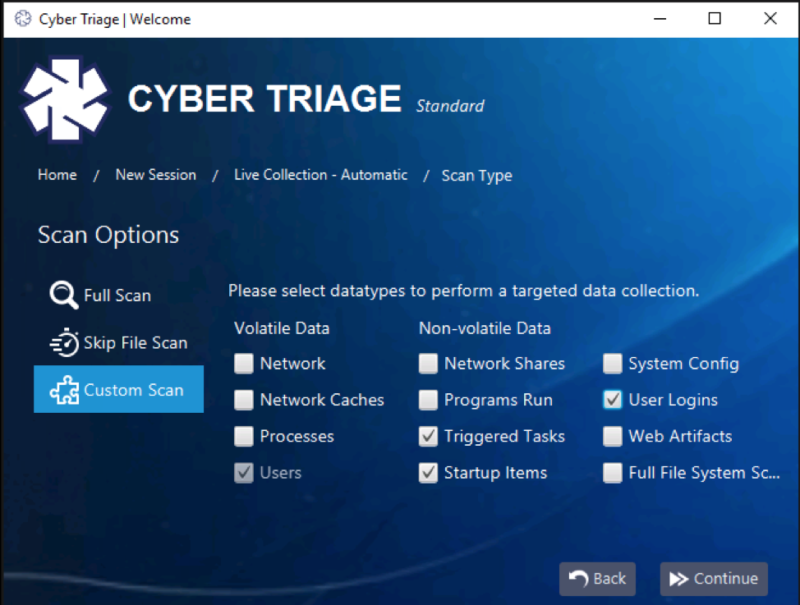
We deploy Cyber Triage to collect Startup Items, Triggered Tasks, and User Logins:
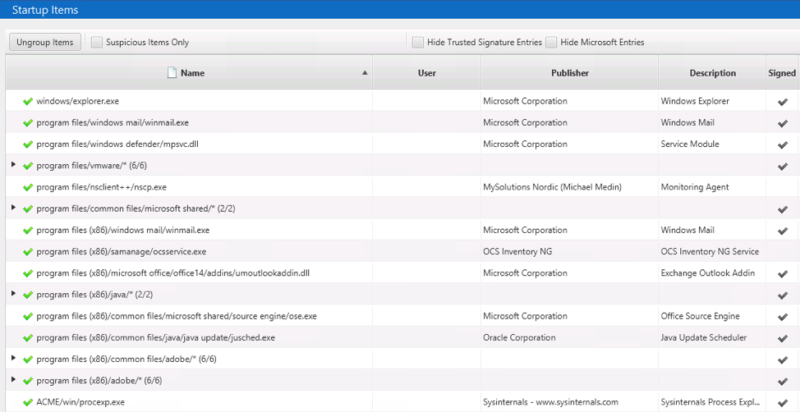
Cyber Triage sends the executables to Reversing Labs for malware analysis and nothing is found:
The user accounts are analyzed and the executive’s account is flagged because of numerous outbound remote logins: 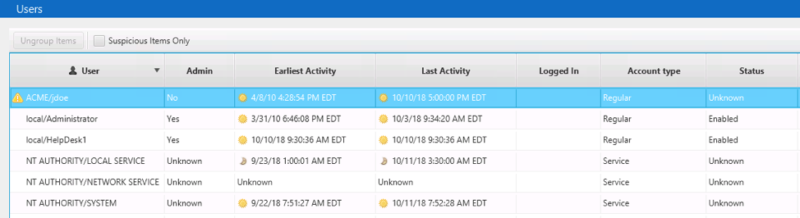
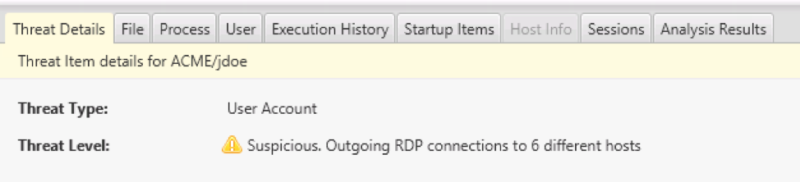
This is an example where Cyber Triage’s analysis techniques will filter out the hundreds of logins and allow us to focus on observing a subset of them that are suspicious. We will need to pull in knowledge about the technical abilities of the CEO to later decide if he or she is expected to be remote desktopping around.
Stay tuned until the next posting….
Have You Observed You Could Use a Visibility Tool?
The observation phase in the OODA loop is all about having access to data so that we can later reason about it and make decisions. And for that, having visibility into your endpoints is critical.
If visibility is a problem for you (or you’d just like to follow along with this series), then I recommend trying Cyber Triage. Cyber Triage ensures you have a clear view of all the data you need during your investigations, and you can access a free trial of the software by clicking this link.
Thanks again, and come back in a few weeks for our next article in the series. Or, you can get the next article sent directly to your inbox by subscribing to The Cyber RespondIR.


